- Use cases
- Co-Creation Space
Community
Organizations
Collaboration Partners

- Login
NOT REGISTERED YET?
Register for the Use Case Management Service for free to start creating your first use case.
Registered users can use the download area and the comment functions.

All dokuments are licensed as a Creative Commons Attribution-NonCommercial-ShareAlike 4.0 International License
(Attribution-Non-Commercial-ShareAlike 4.0). Further information can be found at
![]()
The documents reflect the current best practice and do not claim to be complete. They should not to be understood in the sense of a generally valid recommendation or guideline from a legal point of view. The documents are intended to support appointing and appointed parties in the application of the BIM method. The documents must be adapted to the specific project requirements in each case. The examples listed do not claim to be complete. Its information is based on findings from practical experience and is accordingly to be understood as best practice and not universally applicable. Since we are in a phase in which definitions are only emerging, the publisher cannot guarantee the correctness of individual contents.
The use case provides a methodology for evaluating the Visual comfort of an existing building with purpose to inform design strategies towards the renovation of the living space daylight performance. In order to validate the daylight performance of a building for renovation, the process takes will take into account industry standards requirement for daylight and comfort (LEED, BREEAM, WELL). Furthermore, having a real demo case to test, the workflow will cross-reference two kinds of data, the simulated data and the sensor data in order to validate the daylight performances reading and insights.
To assess the demo case Lighting and Visual comfort before and after renovation through industry standard tools to:
When preparing for the assessment of daylight and visual comfort, there is a consideration towards feasibility in terms of time reduction and integration. In 2021, there are over 20 different computer aided software for simulation of daylight in the market. Each software is categorized based on its interoperability, user interface, learning curve, cross-platform compatibility, IT investment, and workflow, in order to start defining an ecosystem map of all the software fit to the BIMSPEED ambition of reducing cost, time, and providing a cross platform compatibility. There are three software that stands out because of their added value for being able to simulate:
With the growth and accessibility of technology, there has been a shift in how space performs and is being used. Nowadays, our homes are becoming spaces for work and play as well. With these shifts in mind, comfort and performance become relevant factors in the efficiency of spatial design. D.4.4 proposes a standardized method for the implementation of BIM for lighting and visual comfort and the interoperability solutions between the analytical tools and the BIM-SPEED Platform. It also includes the analysis outcomes of the selected real demonstration cases, Vitoria, Spain. The study is performed through climate-based daylight modelling methods using Radiance software. These tools are Climate studio (for Rhino3D) and Insight (for Autodesk Revit) which are the most notable industry-approved software for Lighting and visual comfort simulations with integrated credit validation for LEED, BREEAM, and WELLS. To be validated, compliance or non-compliance indicators of lighting performances metrics are taken into considerations. Because all the demo-case is renovation buildings in various locations and conditions, it is important to utilize a process of assessing lighting and visual comfort that takes into consideration multiple variables such as geospatial location, building true North, physical context, window to wall ratio, interior material reflectance, and weather data. To achieve accurate reading, the research will focus on 2 metrics:
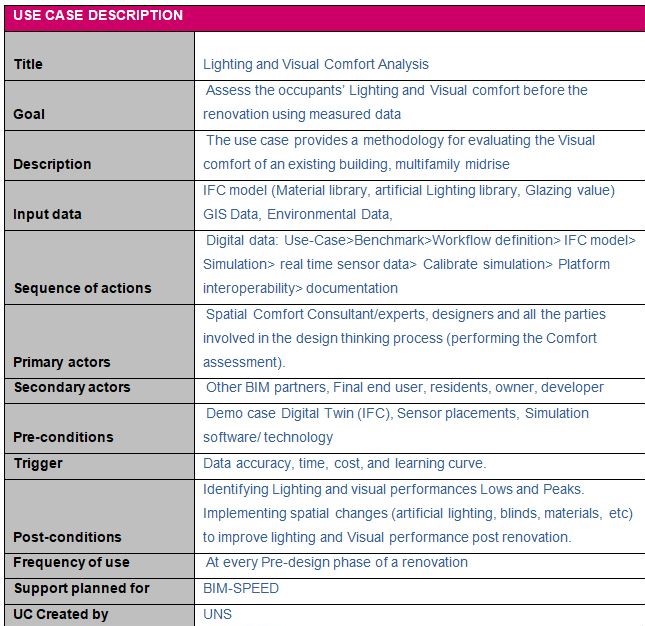
Evidently, this package defines a workflow for the assessment of the spatial visual and lighting comfort in order to reveal opportunities for improvement during the renovation phase. This process aims to reduce time and cost through a computational, human-centric, and industry-standard process towards Visual & Lighting comfort in BIM.
To reduce time & cost of a renovation project by adapting a workflow that assesses and validates design strategies for daylight and visual comfort in a renovation project.
The measured GIS data accuracy could be a limitation as it is often time not updated regularly or easily accessible.
During the simulation phase, if the IFC model is not accurately packaged (correct family, elements, material passport, true north, layers, etc.), the as-built 3D environment could potentially have missing information that will require being input manual.
In case, the demonstration residents are not compliant to sensor placement in their living space (during the documentation phase), this could lead to insufficient amount of measured real-time data to be compared to the simulation.
Residential - Multifamily Core and Shellv4.1 - LEED v4.1 Daylight and Quality Views Indoor Environmental Quality
LEED BD C: Homes and Multifamily Lowrise LEED BD C: Multifamily Midrise
Data Sheet Standards:
|
WELL |
|||
|
Requirements |
Visual Lighting Comfort (sDA300,50%) |
Sunlight exposure (ASE1000,250) |
WELL Circadian Lighting |
|
average of 215 lux [20 fc] in the living room. |
(sDA300lux,50% achieved for at least 55% of regularly occupied space/year |
During the daytime, 200 + melanopic lux facing the wall in the center of the room 1.2 m above Ground |
|
|
average of 50 lux [5 fc] in the bedroom. |
(ASE1000lux,250) is achieved for no more than 10% of regularly occupied space/ year |
During the nighttime, lights provide no more than 50 melanopic lux as measured 0.76 m above ground. |
|
|
average of 100 lux [9 fc] |
|||
|
BREEAM |
|||
|
Building/ Area type |
Minimum Area to comply |
Avg Daylight Illuminance |
Minimum Daylight Illuminance |
|
Living rooms, dining rooms, studies (including home office) |
80% |
At least 100 lux for 3450 hours per year or more |
At least 30 lux for 3450 hours per year or more |
|
Non-residential/communal occupied spaces |
80% |
At least 200 lux for 2650 hours per year or more |
At least 60 lux for 2650 hours per year or more |
|
LEED |
||
|
Daylight |
Calculation requirement |
Measurement Time |
|
Levels between 150 lux and 5,000 lux for at least 50% of the regularly occupied floor area |
Calculate at 9 a.m. and 3 p.m. on a clear-sky day at the equinox. |
Measurements during the day sometime between September 1st and October 30th or March 1st and April 30th. |
|
average of 50 lux [5 fc] in the bedroom. |
Calculate on a maximum 5 foot (1500 millimeters) square grid. |
measure at 30 inches (76 millimeters) above the floor. |
|
average of 100 lux [9 fc] |
Exclude blinds or shades from the model. Include permanent interior obstructions. Movable furniture and partitions may be excluded. |
|
DoA: Description of Action
BEM: Building Energy Model
BIM: Building Information Modelling
BS: BIM-SPEED
GIS: Geospatial Information System
IEQ: Indoor Environmental Quality
IPMVP: International Performance Measurement and Verification Protocol
IPR: Intellectual Property Right
KPI: Key Performance Indicator
M&V: Measurement & Verification
POE: Post Occupancy Evaluation
VR/AR: Virtual / Augmented Reality
UC: Use Case
IESNA: the Illuminating Engineering Society of North America
DF: Daylight Factor
sDA: Spatial Daylight Autonomy
ASE: Annual Sun Exposure
VLT: Visible Light spectrum Transmitted
IFC: International Foundation Class
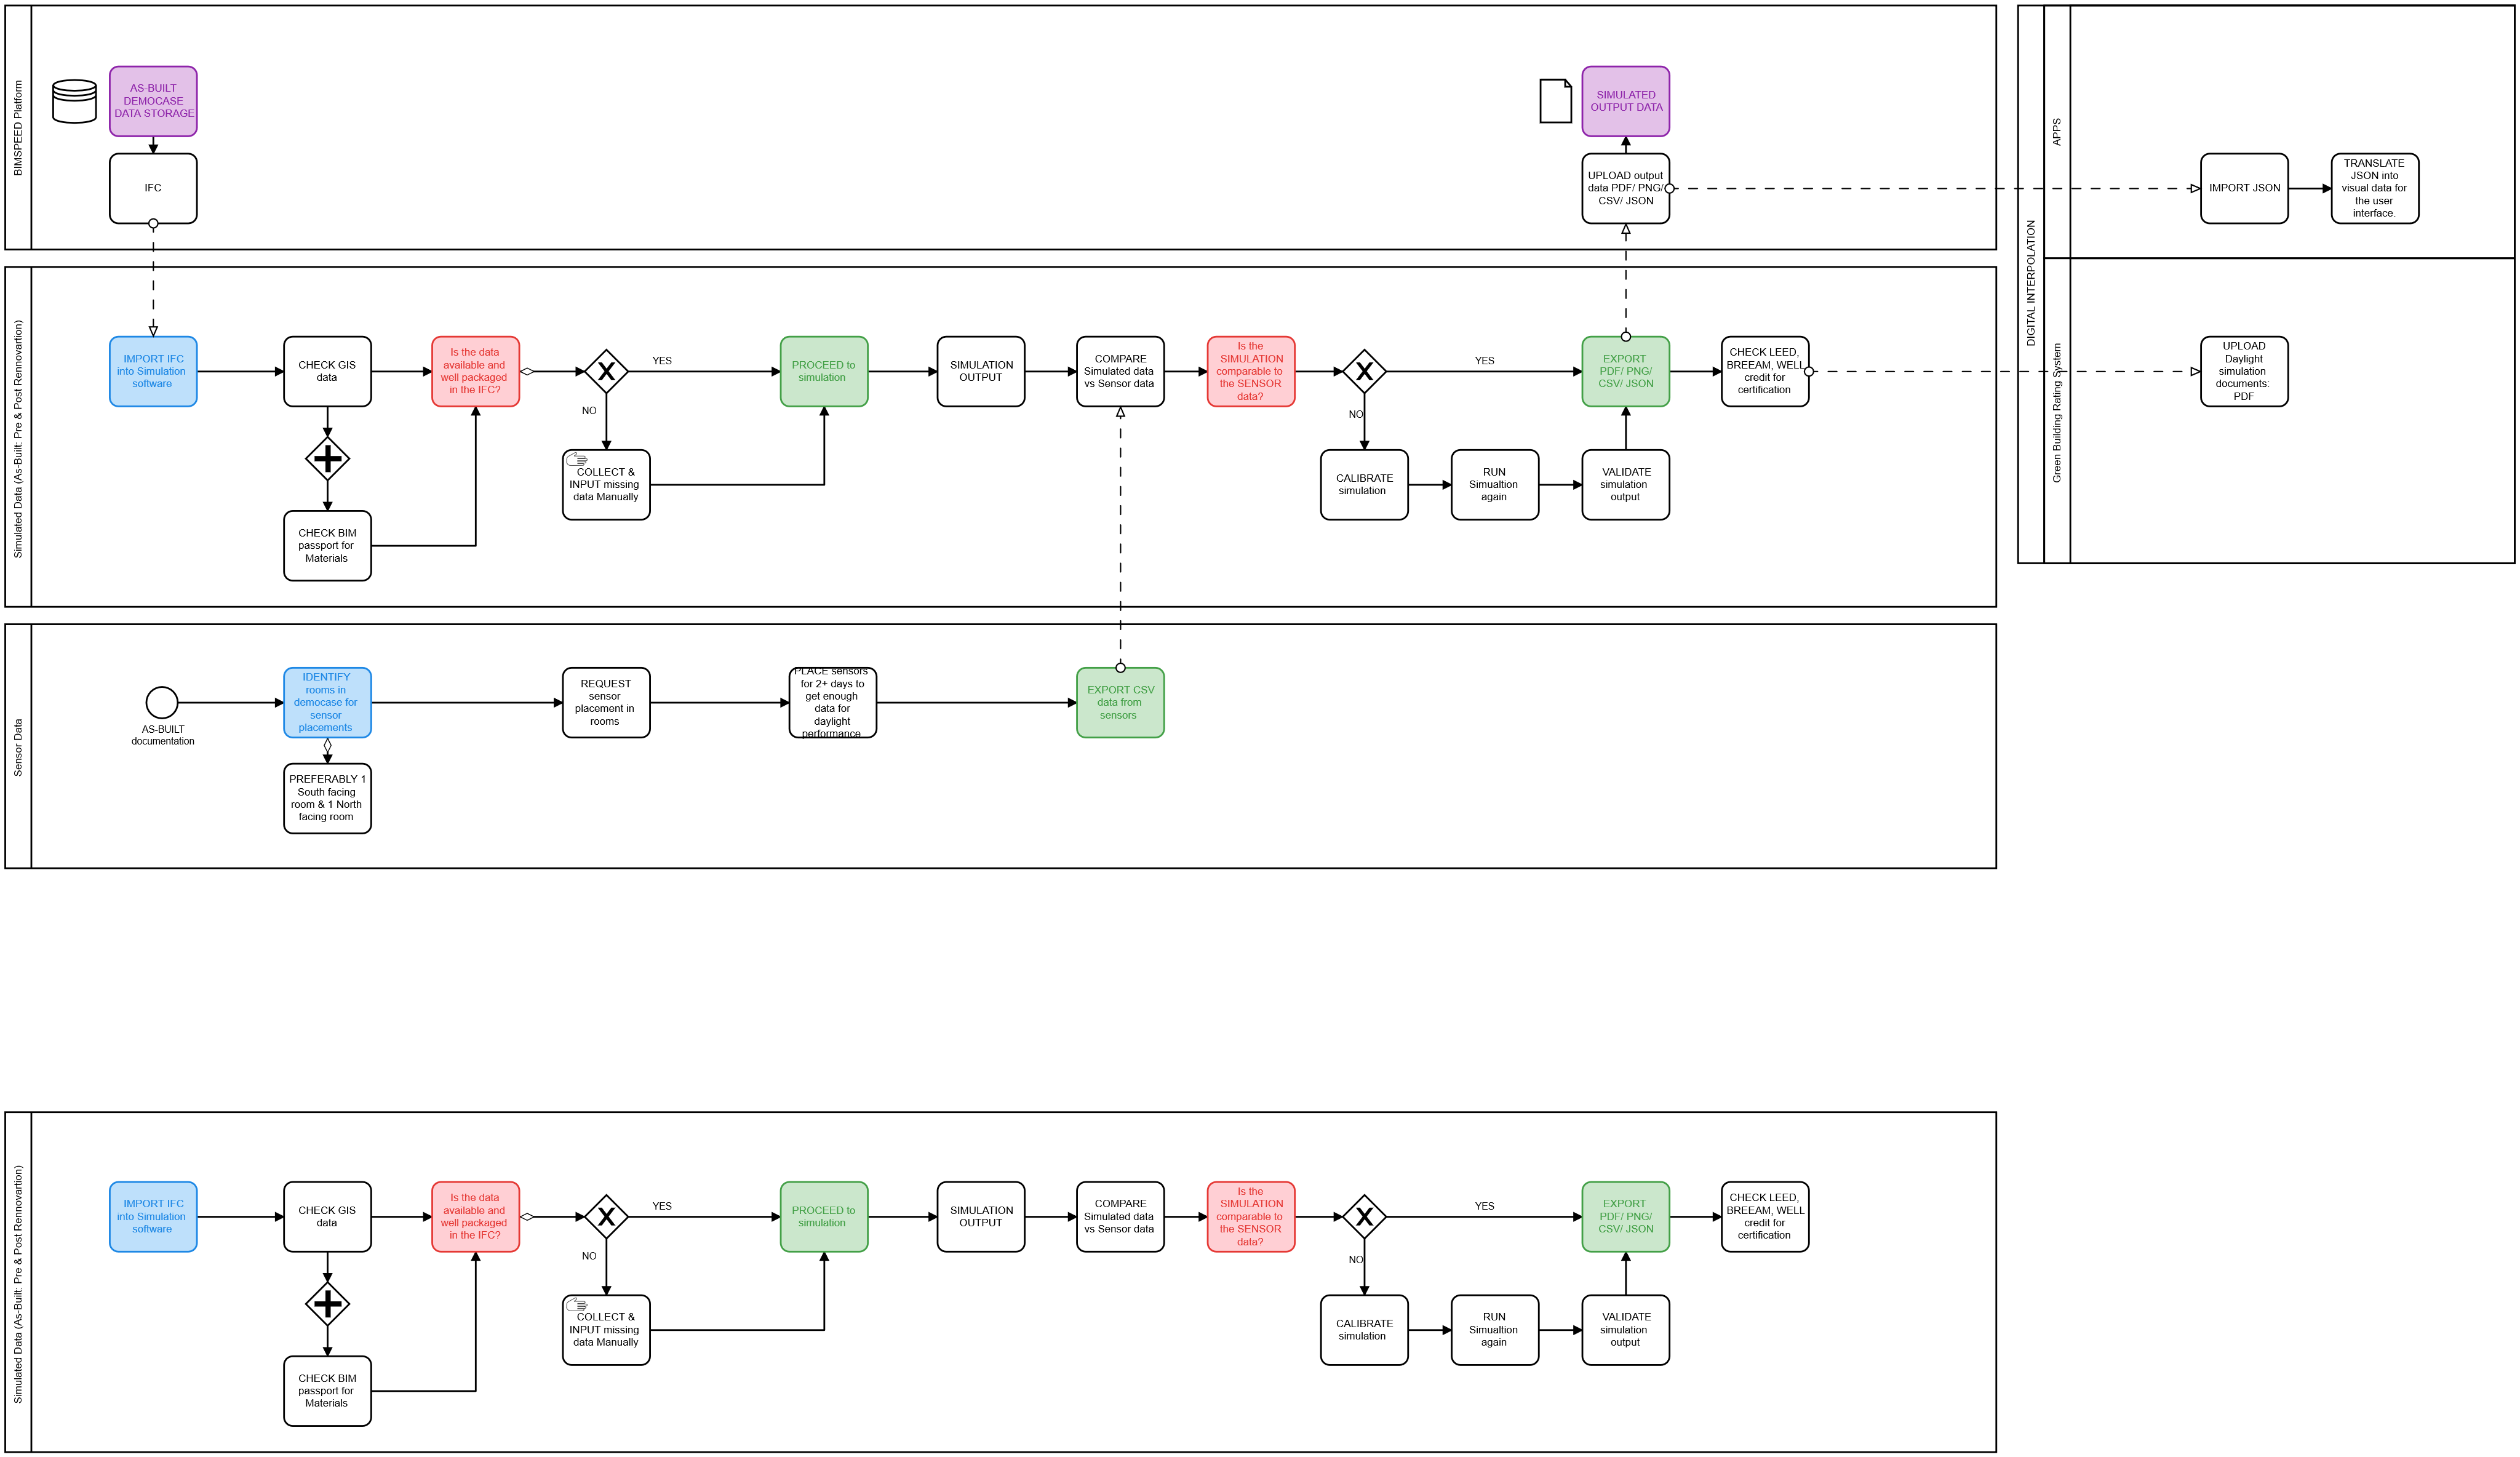
Throughout the BIMSpeed Research, the consortium partners communicate and exchange files through the BIM platform. It is a central collaborative platform where all the demo case data are stored for documentation and coordination. The BIM platform functions as a folder-based interface with each demo case having its own digital folder, building 3D information, drawings document, research, energy, and comfort studies.
For the Daylight and Visual Comfort assessment, there is a two-way interaction with the platform. It is the starting point where the IFC of each demo case is stored and imported into the designer’s server. Once exported out of the platform, the IFC is checked in order to verify the accuracy of the information packaged such as:
In case these data are missing from the IFC, it is recomended to collect and input the data manually. To do so, one should refer to the BIM platform inside the As-Built data. Only after the IFC model is well packaged can the simulation start. Once the simulations are completed, the software compiles a folder containing the data output files which can then be exported and exchanged into the BIM platform. These files are broken into three categories:
These files type become exchangeable data that is translated into the BIM platform for the user to access.
To achieve BIMSPEED ambitions, two different workflows are tested to define areas of opportunity to achieve speed and cost efficiency pre and post renovation. The common practice requires the involvement of a lighting or comfort specialist to run the simulations separately from the designer, which often leads to:
The use case creates an unprecedented workflow that creates a seamless and inclusive design approach towards renovation by equipping the designer and collaborators with the tools and the “know-how” for daylight & visual comfort assessment; which, ultimately contributes to:
When preparing for the assessment of daylight and visual comfort, there is a consideration towards feasibility in terms of time reduction and integration. In 2021, there are over 20 different computer aided software for simulation of daylight in the market. Each software is categorized based on its interoperability, user interface, learning curve, cross-platform compatibility, IT investment, and workflow, in order to start defining an ecosystem map of all the software fit to the BIMSPEED ambition of reducing cost, time, and providing a cross platform compatibility. There are three software that stands out because of their added value for being able to simulate:
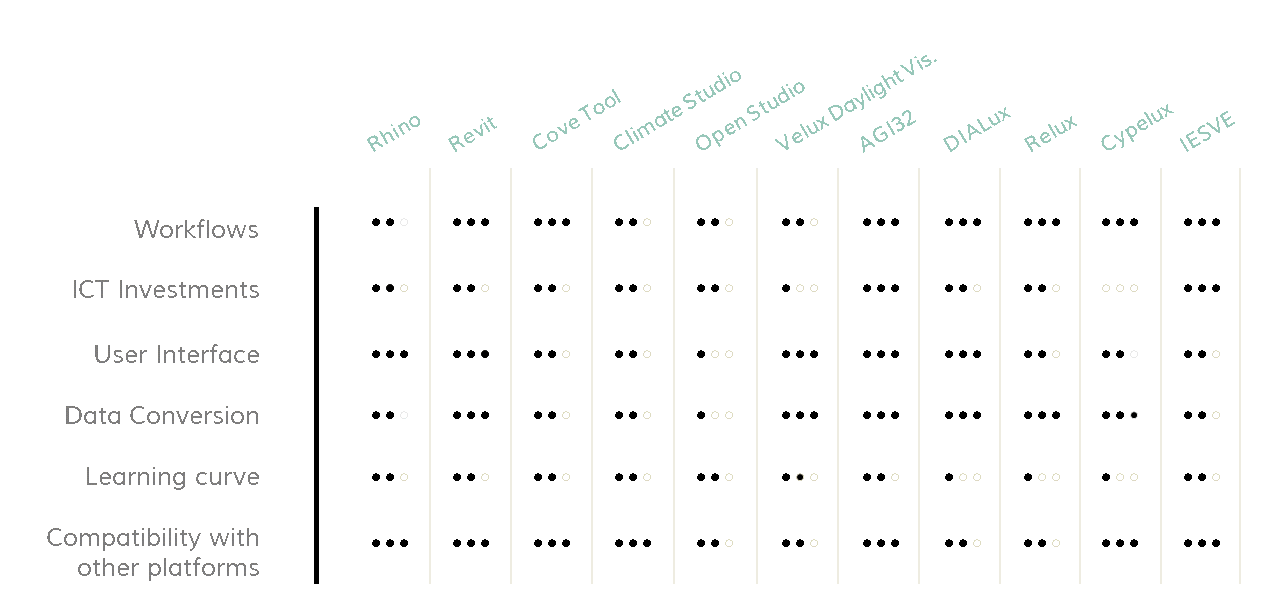
Fig: Software Benchmark
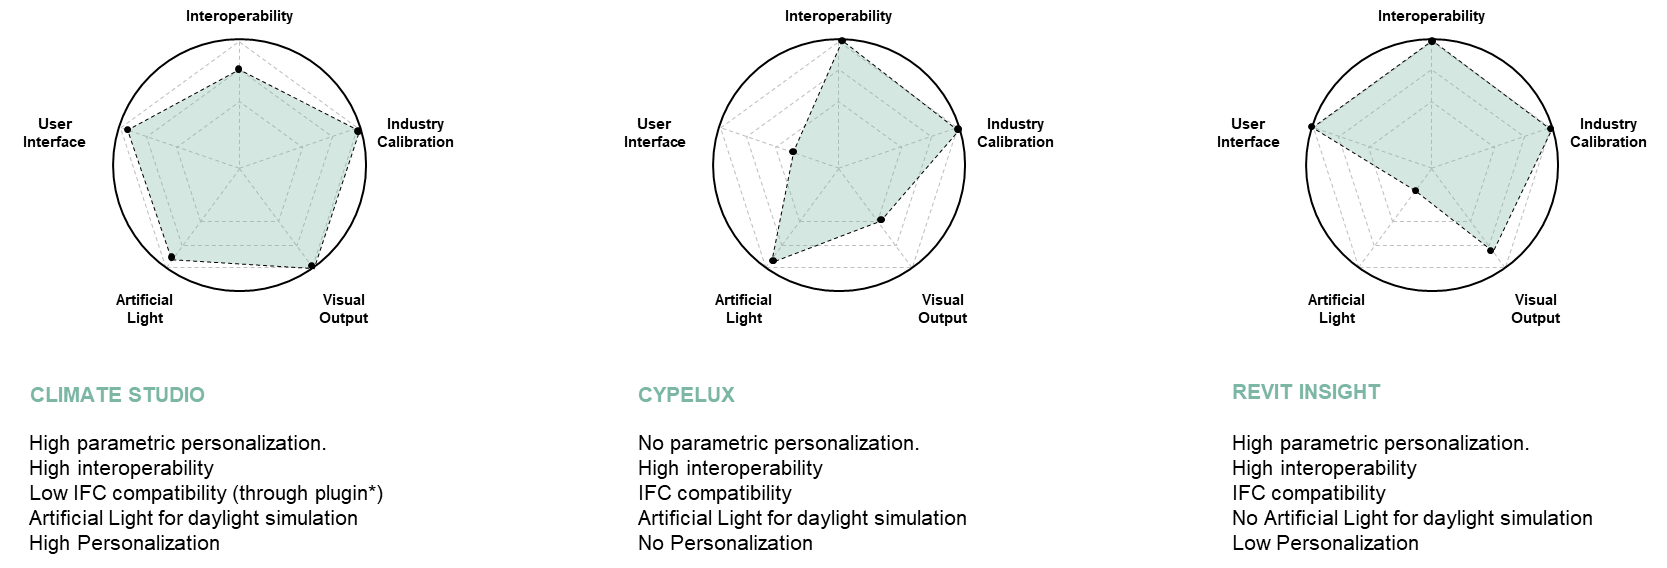
Fig: Software benchmark Graphics
Process Modeling:
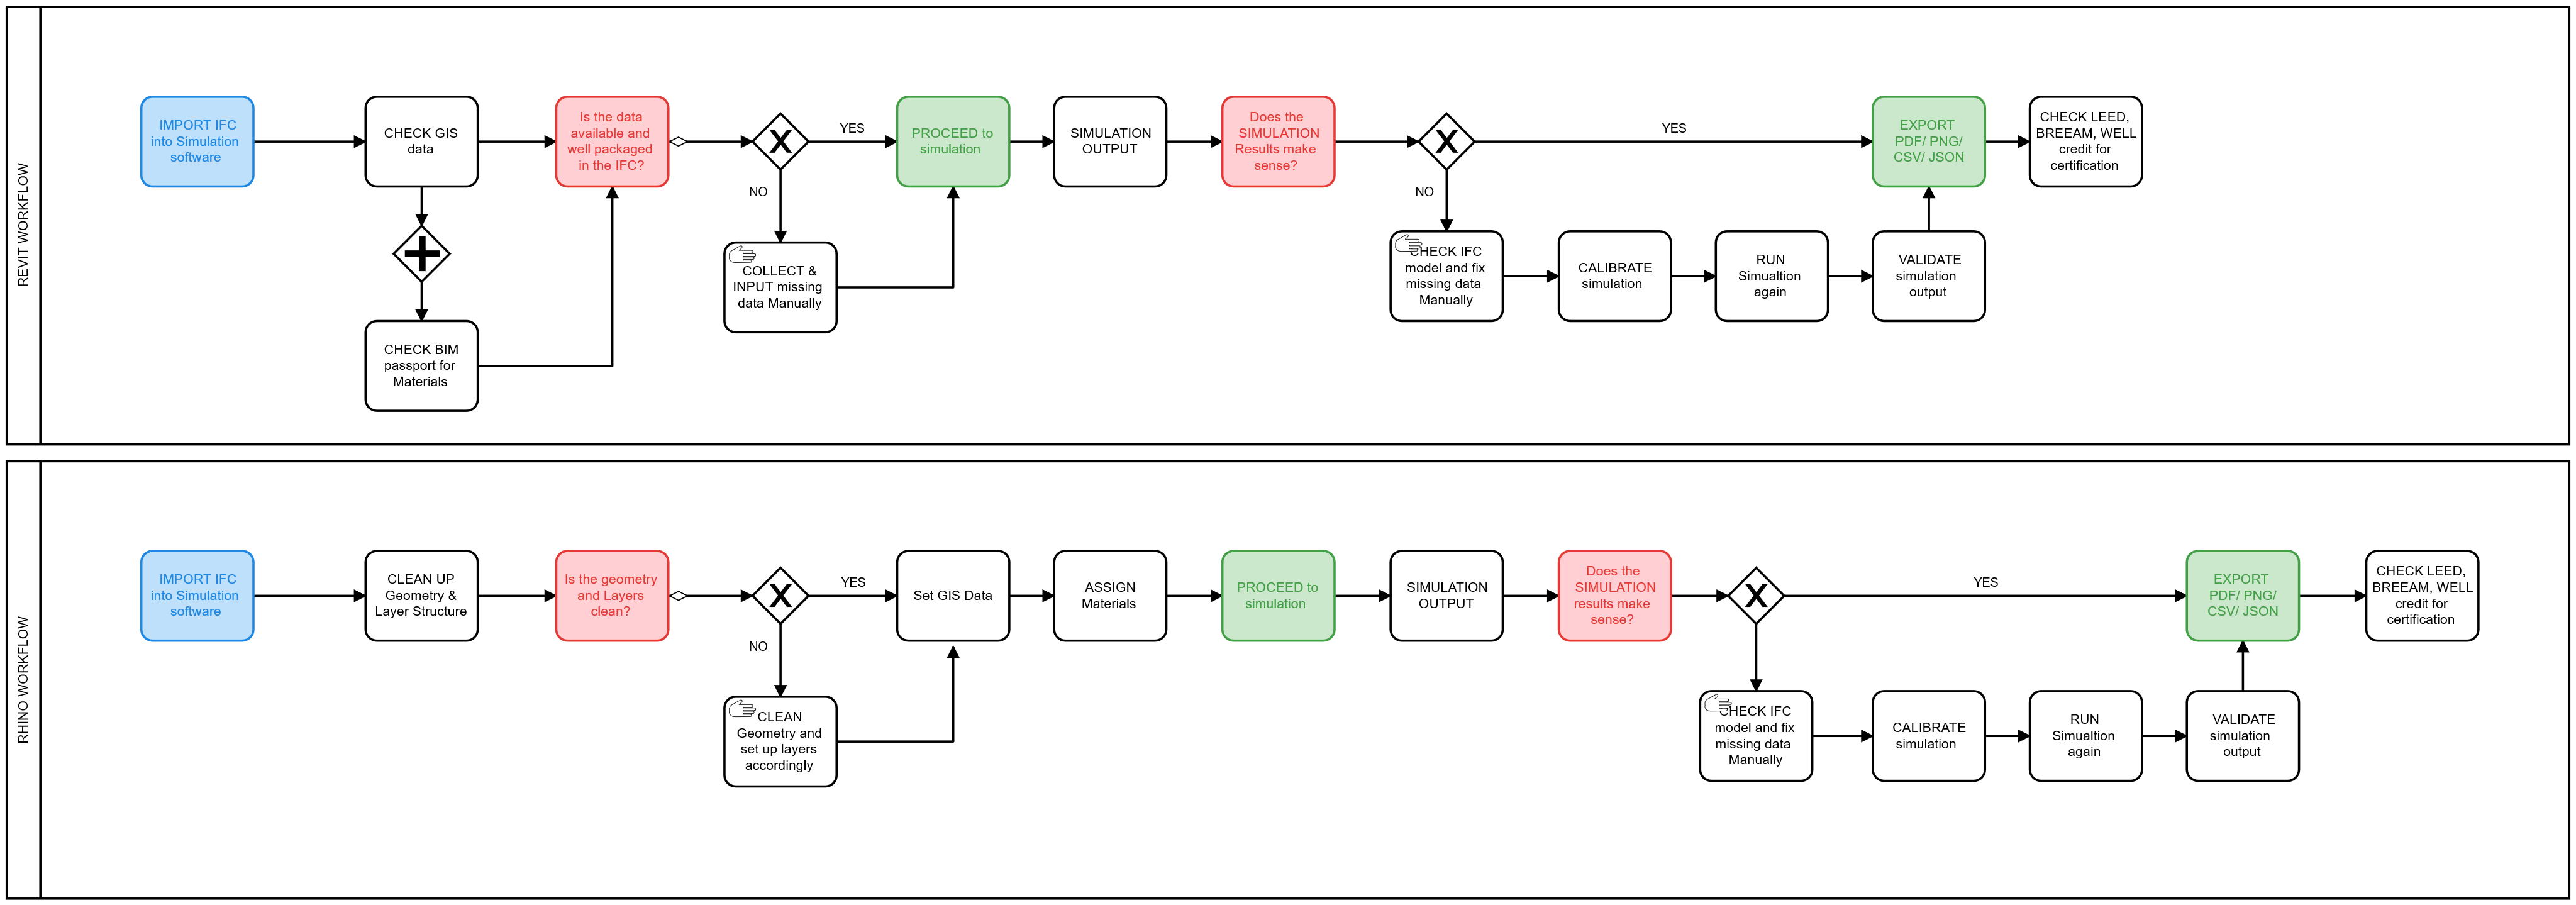
Fig: Simulation Workflow Revit and Rhino
The assessment of Daylight analysis and visual comfort is approached through a 4 step process: IFC import, 3D preparation, Simulation, and output data Export. This use case evaluates two industry standards modeling tool, Rhino and Revit in order to define best practice and efficiency for assessing daylight and visual comfort analysis.
The first step entails importing the IFC model from the BIMSpeed platform into the computer -aided modeling environment, whether Rhino (ClimateStudio) or Revit(Insight). Once in the computer-aided modeling platform, the IFC should be checked for errors or irregularities such as, true-north orientation, material passport, GIS data, etc. In case some of these elements are not accurate, it is recommended to retrieve the data form the BIMSPEED platform if documented and input it back in manually. Most importantly, building materials (wall, floors) and Glazing should be specified in as much details as possible. When all data is aligned, we run the simulation. The duration of the simulation varies based on the LOD (level of Details) of the IFC and the CPU of the computer.
Once the simulation is completed, a set of output data is saved into an internal folder such as, PNG, PDF, CSV; which, can then be exported into the BIMSpeed Platform and for Industry certification accreditation (LEED, WELL, BREEAM).
The Revit and Rhino workflow were both evaluated on speed and efficiency where they each performed differently at different stage of the assessment. Revit, being an IFC compliant software performed efficiently higher than Rhino in the first two phase of the assessment, IFC import, simulation preparation. When the IF is well packaged, this process is a two steps click button.
On the other hand, Rhino had an edge over Revit in its performance and optimization during the last two phase of the assessment: Simulation and Output data. The Rhino-ClimateStudio workflow enables a higher level of customization in terms of material definition, glazing, parameters settings, and output data personalization. These in depth customization enables a circular approach to design thinking, where the renovation concepts can be simulated as the design is being improved in order to determine a comparative output best best suited for the renovation proposal.
Effectively, understand the areas for improvement of each workflow details a constructive insight on further optimization solutions and areas where each platform might be more effective. Revit-Insight is more efficient for final designs where a simulation is only a click of a button; while, Rhino-ClimateStudio might be more effective when multiple design elements of the renovation can be comparatively tested and improved along the design process.
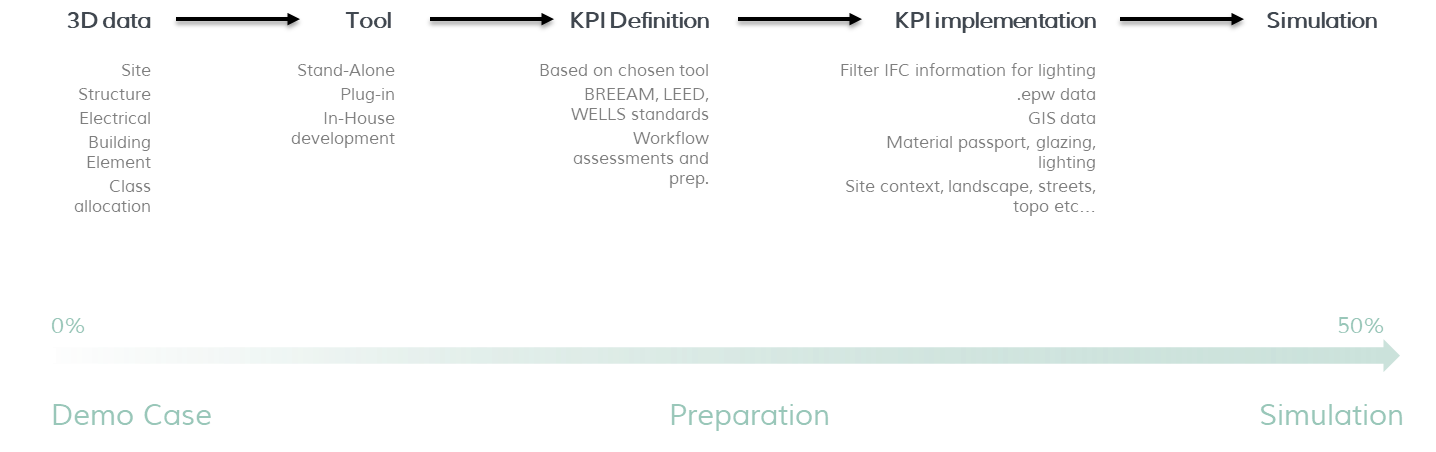
Fig: Simulation Workflow A
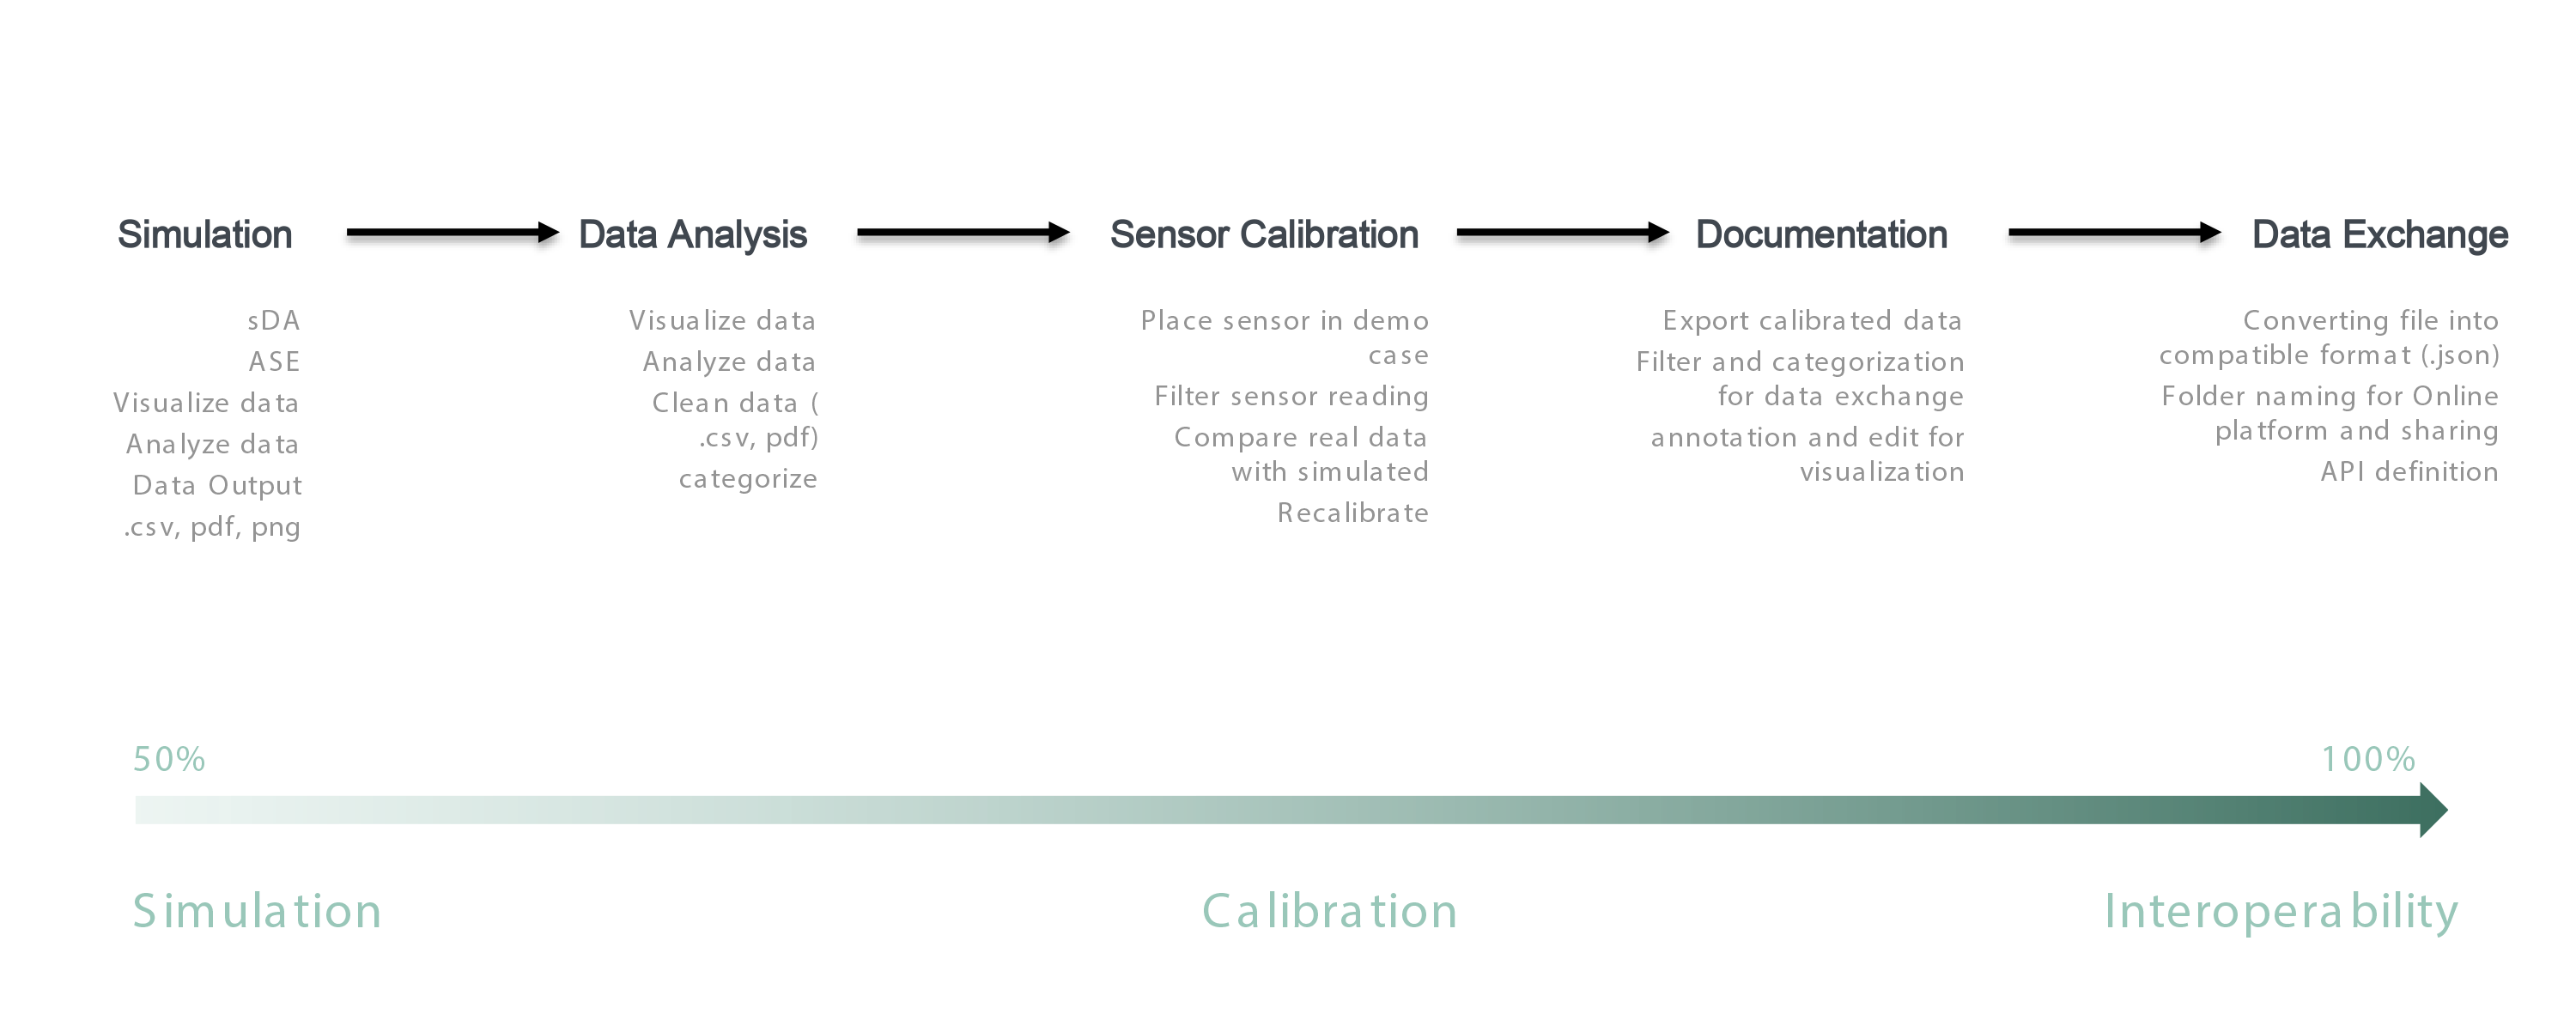
Fig: Simulation Workflow B
Demonstration Case:
This document highlights the assessment for daylighting performance and probability for LEED daylight and views credit EQc8.1. The simulation is performed on the demo case building in Vitoria Spain. The daylighting analysis was carried out using 2 industry-approved software: Climate Studio lighting simulation software developed by Solema for Rhino 3D, and Insight simulation software developed by Autodesk for Revit.
Certification is achieved by accrediting points to the building if it achieves illuminance levels between 300 lux and 3,000 lux for at least 50% of the regularly occupied floor area with furniture, fixtures, and equipment in place. For spatial Daylight autonomy points: Demonstrate through annual computer simulations that spatial daylight autonomy300/50% (sDA300/50%) of at least 55%, 75%, or 90% is achieved. Use regularly occupied floor area. Finally, the living areas’ Annual Sunlight Exposure1000,250 (ASE1000,250) should not exceed more than 10%.
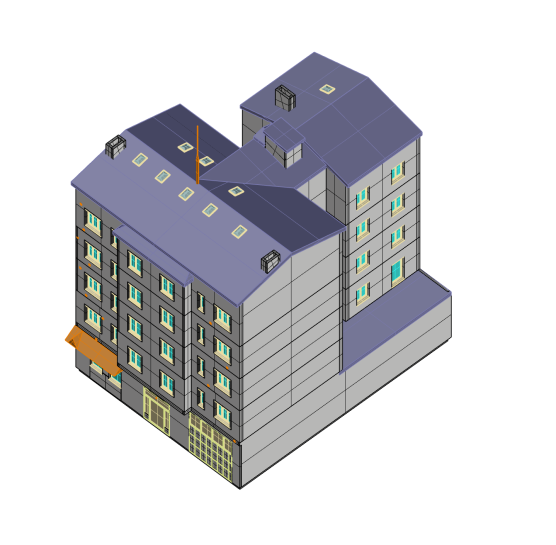
Fig: Victoria, Spain Project Model View
The building is located in Vitoria, Northeast of Spain.
* Building address: Manuel Diaz de Arcaya Kalea, 5 01012 Gasteiz, Araba, Spain.
* True North= 21.5 deg (Northeast Quarter facing façade)
* Building Occupancy=Midrise Apartment
* All of the assessment results in this study were conducted on an analysis plane positioned 85 cm above each finished floor.
* To be industry compliant, the date and times for the simulation were set on the Equinox, Sept. 21 between 9 a.m. and 3 p.m.
* The measurement plane grid size (??) should be between 25cm> ?? < 300cm
* The luminance sky distribution set in Climate studio and Insight lighting simulation software was clear sky.
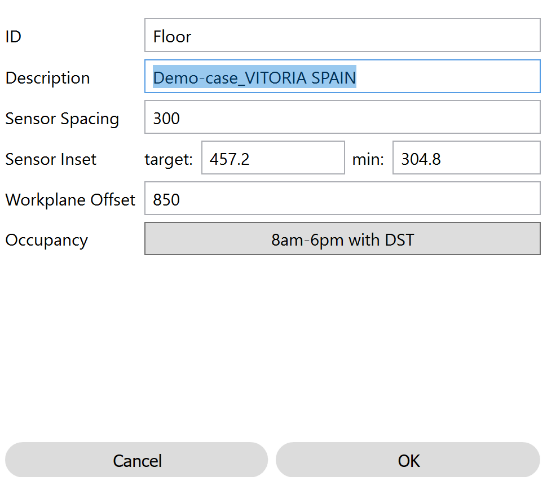
Fig: Rhino simulation Interface
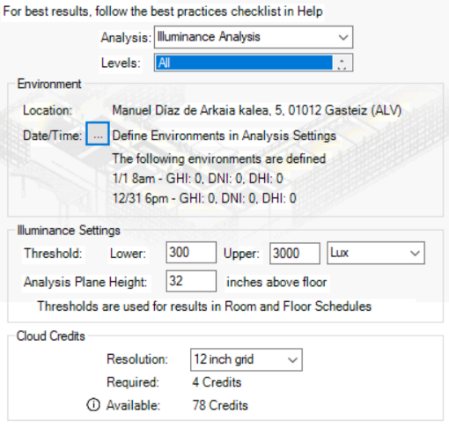
Fig: Revit simulation interface
3. Simulation Preparation
The best practice for daylight-compliant simulations should consider material properties. The IFC (International Foundation Class) model of the demo-case taken from BIMSpeed should already contain a high accuracy of material finishes and glazing VLT values (Visible Light spectrum Transmitted). Nonetheless, before to running the simulation, it is best to go through the BIM passport to check the accuracy of the imported IFC model. With the chosen simulation software, layer assigns the materials and finishes or Family properties based which requires the import of the 3D model layered according to the simulation environment. (Fig 3) An example of layer naming for Climate studio:
* Walls
* Floors
* Windows
* Ground
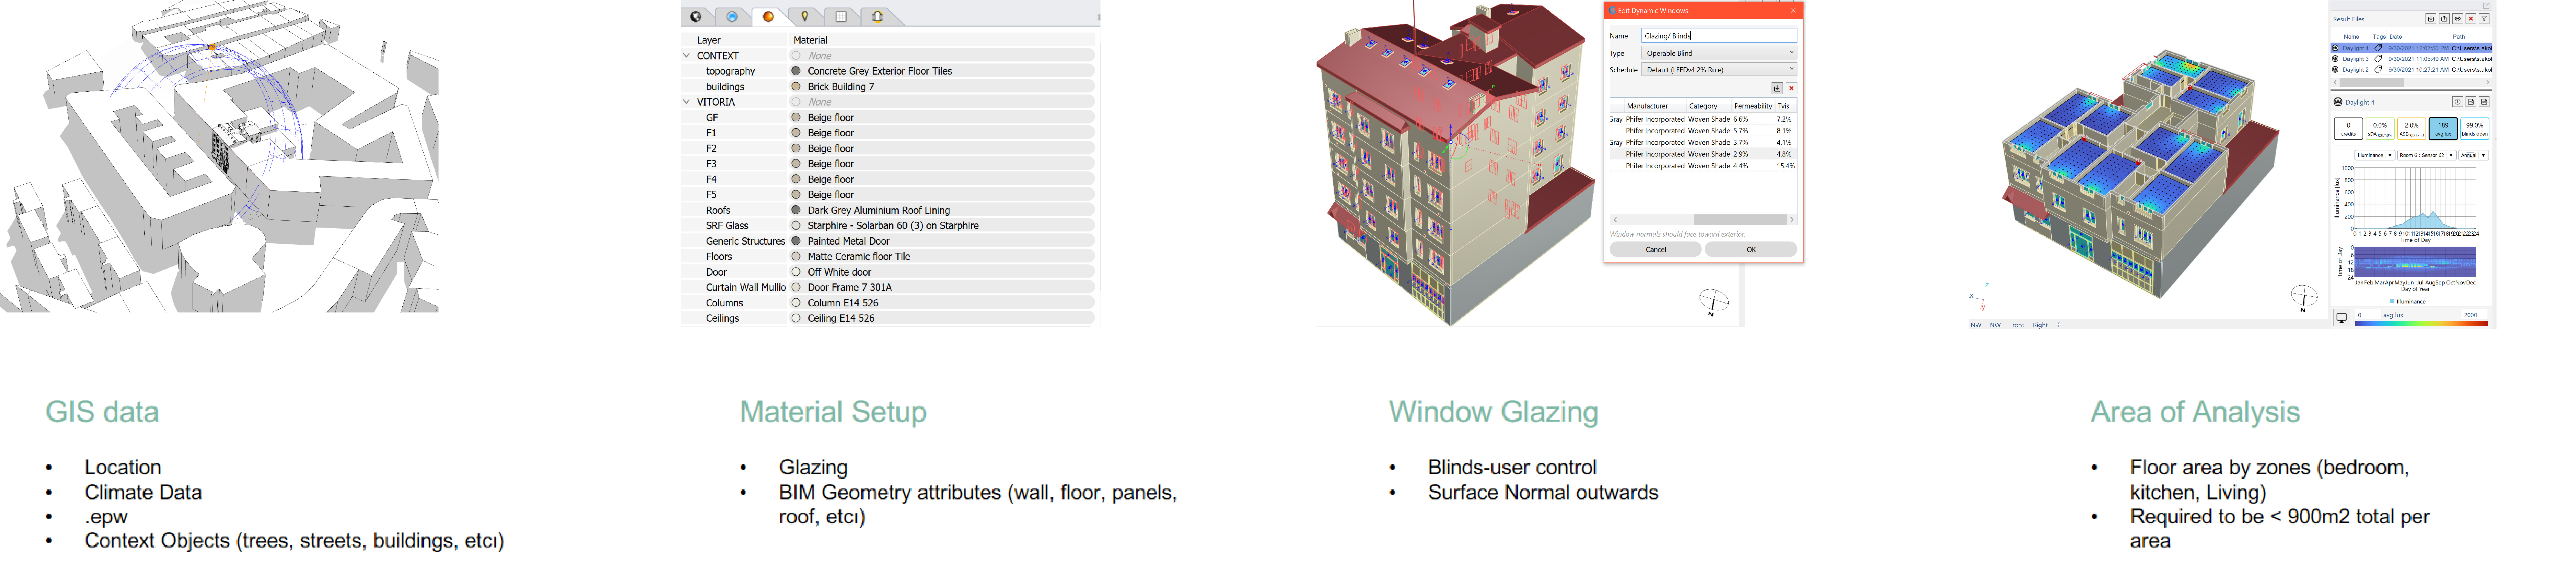
Fig: Daylight Simulation Workflow
Essentially, regardless of the chosen simulation tools, there should be a check or assignment of materials to get an accurate reading of the demo case conditions. Because the demo-case are existing buildings in poor conditions, there are possibilities that some of the materials found on site might be damaged or too old for use. In the case, some materials that are not available in the IFC documentation, a generic or close to the original option should be used.
Once ready, we run the simulation. The simulation time is a factor in the tools used. For the simulation of this demo case, the average time for simulation is 18-25 minutes with the mentioned settings (Fig.2). The time of the simulation depends on multiple factors, most notably the measurement plane grid size. The timestamp of the simulation was done with a grid size of 100cm which led to approximately 25 min. with a grid size of 200cm, the time will be cut down to 15 min. Though the time of simulation can be reduced by scaling up the grid size, the accuracy of the reading will also be affected.
Beyond the grid size resolution, the workstation used for the simulation is also a key factor in achieving the speed of simulations. For the simulation done for Vitoria, the workstation specs are:
DELL Precision 5550 laptop
Processor: Intel(R) Xeon(R) W-10855M CPU @ 2.80GHz 2.81 GHz
RAM: 32GB
System Type: 64-bit operating system
Graphic card: NVIDIA Quadro T2000
Furthermore, it is important to know that the speed of simulation could be increase with workstations with higher computing power.
4. Output data daylighting and visual comfort simulated data
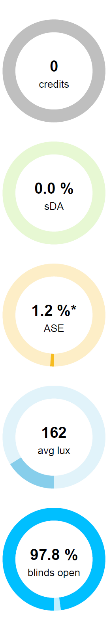
An assessment for daylighting performance and probability of achieving LEED daylight and views credit EQc8.1 was performed for Vitoria Demo Case in Spain. The daylighting analysis was carried out using Climate Studio and Revit Insight lighting simulation software. The daylighting performance of the building did not meet the requirements to achieve EQc8.1. The overall daylighting performance is poor. From the daylighting analysis results, 9% of the regularly occupied space floor area is 300 to 3000 lux illumination level at 3 p.m. and 3% at 9 a.m. The "as-built" status does not achieve any LEED points.
The living areas' Annual Sunlight Exposure1000,250 (ASE1000,250) is 1.2% which meets the requirement by not exceeding more than 10% annual exposure. The 1.2% which are areas of exposure should be addressed by adding darker blinders to reduce high glare and improve visual comfort. The simulation shows that the Vitoria demo-case being a North facing Building does not meet the required daylight exposure for assessed living areas. The South façade being situated in a courtyard and having only a few windows does not allow light to permeate through the building. The highest daylight level is situated on the 2nd Floor and the 5th Floor of the building where there is a higher window to wall ratio. The lowest daylight exposure is found on the 1st floor which is the lowest living area plane of the building. These results give in-depth insight on areas for improvement for daylighting and visual comfort.
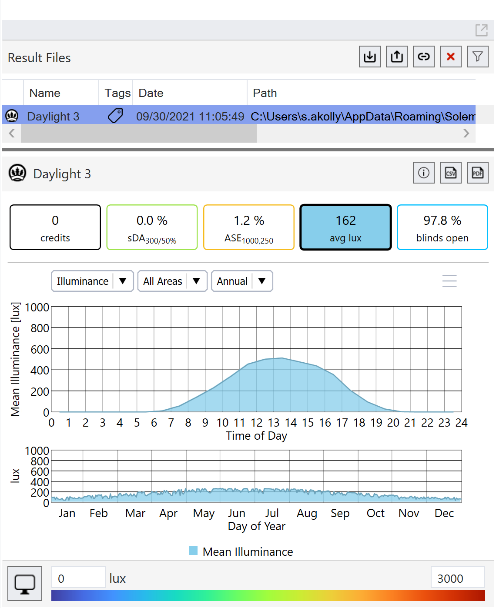
Fig: Simulated data graph
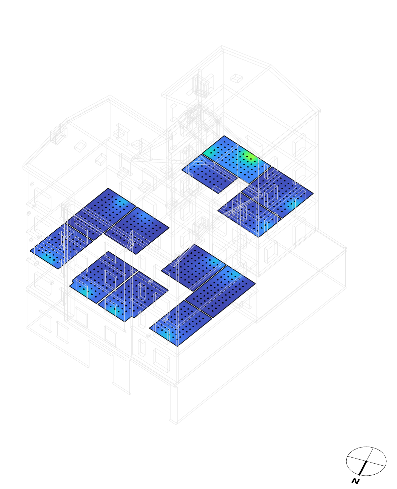
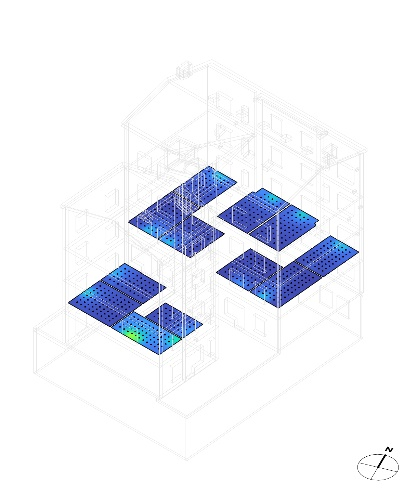
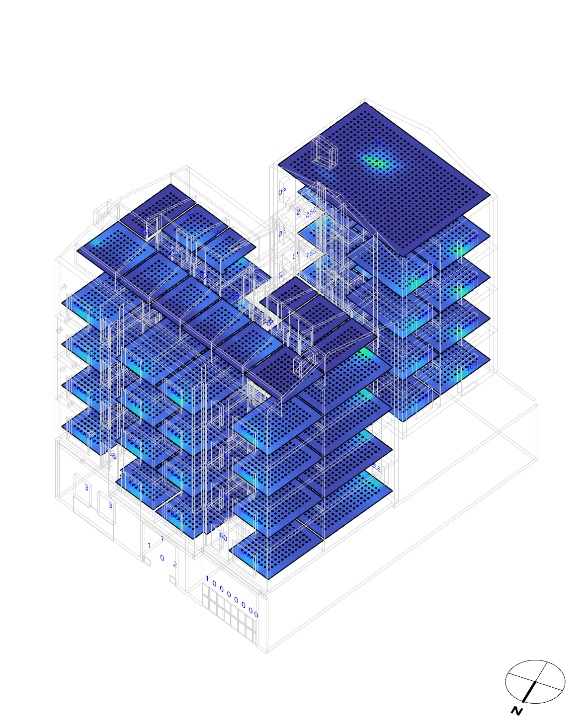
Figs: LEED Credit grading Panel, Vitoria 2nd floor North, South and complete simulated view respectively
The simulation shows that the Vitoria demo-case being a North facing Building does not meet the required daylight exposure for assessed living areas. The South façade being situated in a courtyard and having only a few windows does not allow light to permeate through the building. The highest daylight level is situated on the 2nd Floor and the 5th Floor of the building where there is a higher window to wall ratio. The lowest daylight exposure is found on the 1st floor which is the lowest living area plane of the building. These results give in-depth insight on areas for improvement for daylighting and visual comfort.
The methods used in the documents focuses on 3 daylight assessment metrics:
The Daylighting Factor (DF), is a ratio defining the level of light that permeates a structure compared to the level of external light the structure receives. Daylight factor is one of the old measures to quantify the amount of daylight exposure in vs outside a room. Daylight Factor takes into consideration window to wall ratio, and interior material reflectance, and doesn’t take into consideration building geospatial orientation, function, nor environmental context (GIS data). Because DF calculation only focuses on light permeability through glazing, the DF is found less efficient in defining the true performance of light and visual comfort in an existing building for renovation.
DF = 100 * Ein / Eext
Ein is inside illuminance at a fixed point
Eext is defined as simultaneous outdoor illuminance on horizontal plane from an unobstructed hemisphere of overcast sky (CIE sky) or uniform sky.
Spatial Daylight Autonomy (sDA), is a daylight availability metric that corresponds to the percentage of the occupied time when the target illuminance at a point in space is met by daylight (Reinhart,2001). A target illuminance of 300 lux and a threshold DA of 50% are values that are promoted in the IESNA,2013. (sDA300,50%) is achieved for at least 55% of regularly occupied space. In other words, at least 55% of the space receives at least 300 lux [28 fc] of daylight for at least 50% of operating hours each year.
Annual Sun Exposure (ASE), is the percentage of floor area that receives too much direct sunlight. ASE credits are achieved when simulation average plane is no more than 10% of regularly occupied space. In other words, no more than 10% of the area can receive more than 1,000 lux [93 fc] for 250 hours each year.