- Anwendungsfälle
- Co-Creation Space
Community
Organisationen
Kooperationspartner

- Anmelden
The ‘Indoor acoustic comfort calculator’ implemented as part of BIM-SPEED project is developed with the need for the objectives set by the BIM-SPEED Project. The indoor acoustic comfort calculator allows to assess the acoustic comfort inside each room of a building and to determine also the global acoustic comfort Key Performance Indicator (KPI) of the entire building with the scope of providing support to the residential renovation project. The main purpose of the use case is to provide:
The use case presented is a tool to assess the indoor acoustic performance on both room and building scale. The methodology makes use of BIM model and the outdoor noise level to provide the acoustic class of a single room or of the whole building. Theoretical basis and standards used to predict the indoor sound pressure level and the method to assign the acoustic class are explained. The tool can be used to also predict the post renovation acoustic comfort performance and to provide a classification of the renovation scenarios suggested.

The application of the indoor acoustic comfort calculator will boost the reduction of time & cost of a renovation project by adapting a workflow that assesses and validates design strategies for acoustic comfort in a renovation project.
The limitation of the calculator is that it needs as input the external noise level. This level is generally known if a strategic noise mapping of the area where the building is located is available. Otherwise, a direct measurement of the external noise level is required. Even though is preferable to use the strategic noise mapping, when available, the uncertainty on the estimation of the indoor sound pressure level from the external noise level provided by the map is very high. Therefore, a direct assessment of the external noise levels measured in front of the façade of the building under investigation is beneficial to improve the confidence on the acoustic KPI estimation.
Strategic noise mapping: map of the average outdoor noise level provided by local administrations for different urban areas.
Rw: Sound Reduction Index
BIM: Building Information Modelling
IEQ: Indoor Environmental Quality
IFC: International Foundation Class
KPI: Key Performance Indicator
SPL: Sound Pressure Level
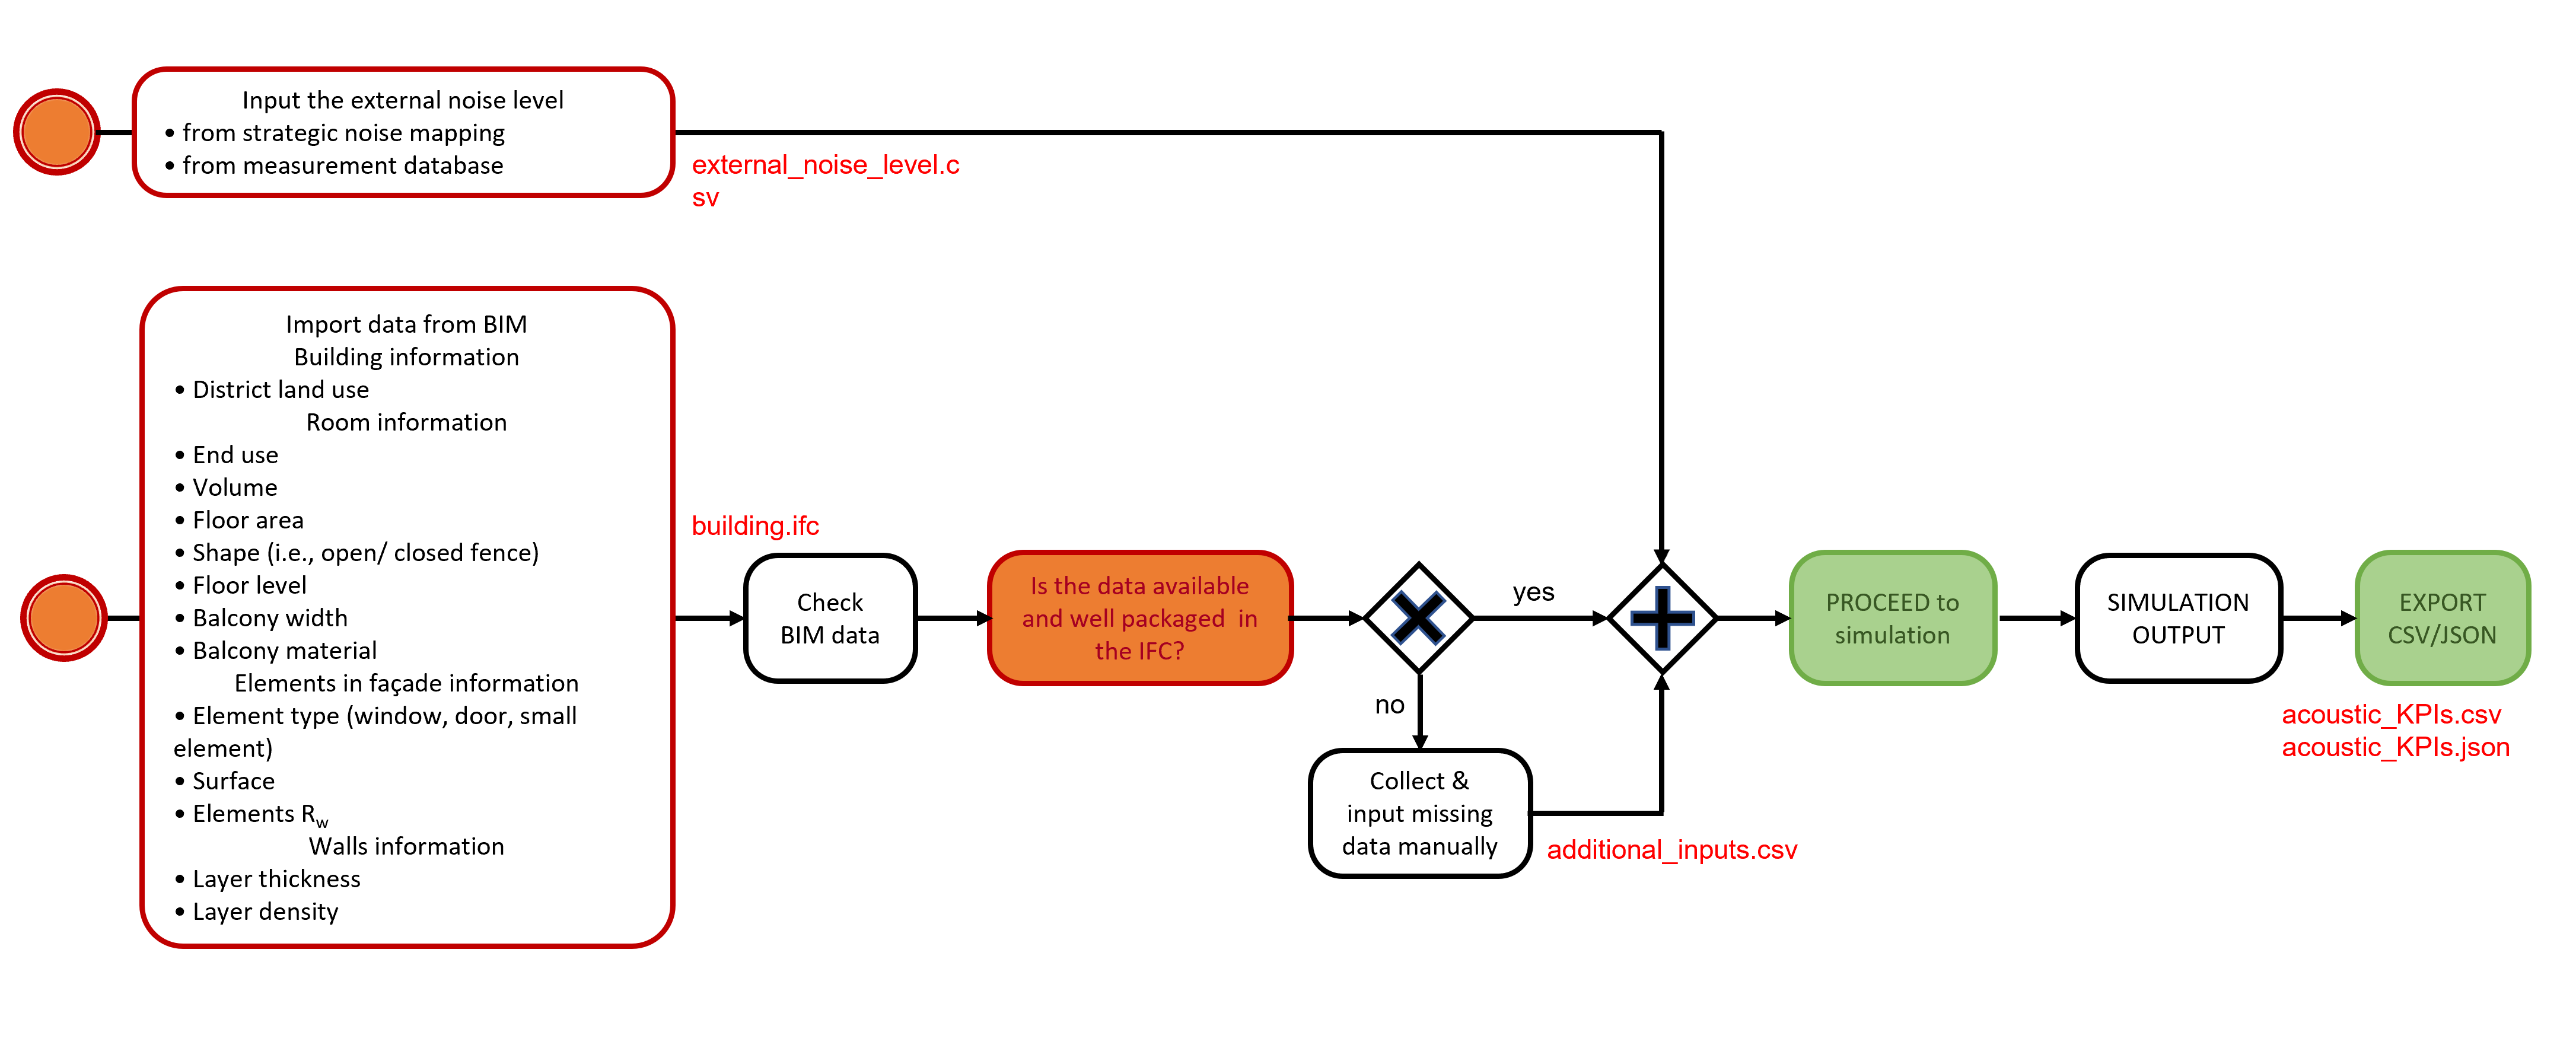
The exchange requirements mapping is given in Figure 25.
The Acoustic Calculator requires inputs from the BIM platform in the .ifc format and from measurement data related to the external acoustic level stored in .csv files. In case these or other data are missing they can be entered manually always by .csv files.
The Acoustic Calculator gives as output the Acoustic KPI of the building (the entire building or each room) which is saved in .csv or .json files that are compatible with the Metabuild platform.
All dokuments are licensed as a Creative Commons Attribution-NonCommercial-ShareAlike 4.0 International License
(Attribution-Non-Commercial-ShareAlike 4.0). Further information can be found at
![]()
The documents reflect the current best practice and do not claim to be complete. They should not to be understood in the sense of a generally valid recommendation or guideline from a legal point of view. The documents are intended to support appointing and appointed parties in the application of the BIM method. The documents must be adapted to the specific project requirements in each case. The examples listed do not claim to be complete. Its information is based on findings from practical experience and is accordingly to be understood as best practice and not universally applicable. Since we are in a phase in which definitions are only emerging, the publisher cannot guarantee the correctness of individual contents.
NOCH NICHT REGISTRIERT?
Registrieren Sie sich für den Use Case Management Service kostenlos, um Ihren ersten Use Case zu erstellen.
Registrierte Benutzer können den Download-Bereich und die Kommentarfunktionen nutzen.

The IEQ (Indoor Environmental Quality) is an important aspect in the field of buildings’ renovation because of its impact on human comfort, well-being, productivity, learning capability and health. IEQ derives from the combination of different factors influencing the human comfort sensation: thermos-hygrometry, acoustic, illumination and concentration of pollutant components. The tool presented here allows to calculate the indoor acoustic comfort calculator by merging together measured data and BIM data to perform simulations of the building envelope acoustic performance and to provide acoustic comfort classification. The data flow is sketched in Figure 1 where inputs for the acoustic comfort calculator are evidenced. The BIM provides geometry and material information through the raw IFC, while outdoor noise levels are provided by the BIMSPEED platform. The platform can store the exterior sound pressure level directly measured at 2 meters from the building façade as prescribed by the standard series EN ISO 12354 (by using an acoustic level monitoring system) or retrieved from the strategic acoustic map of the building district.
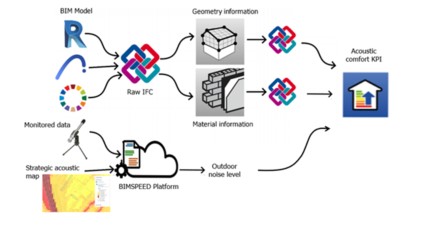
Figure 1: Acoustic calculator tool dataflow
Combining this information, the indoor acoustic comfort calculator tool returns an estimation of indoor acoustic comfort assigning a Class (from A to E) to each room depending on its use. The result is compared with the standards prescribed by European regulation. If minimum acoustic comfort requirement is not met, different renovation scenarios can be outlined. The impact of different renovation options can be assessed using the same tool.
Process definition
The indoor acoustic comfort calculator is a tool based on the estimation of the indoor sound pressure level according to the standard series EN ISO 12354 and it allows to assess the acoustic performance of the building and to assist the decision-making in retrofitting design, ranking different renovation options. The acoustic performance of the building is identified by an “objective KPI” called the acoustic KPI. This indicator is calculated from the sound pressure level estimated inside the rooms of the building from the knowledge of the external noise intruding inside, lowered from the acoustic abatement of the building envelope. The external noise level is generally known if a strategic noise mapping of the area where the building is located is available. However, the estimation of the indoor sound pressure level from the external noise level provided by the map is very high. It has been demonstrated that the main cause of uncertainty in the indoor sound pressure level calculation is the estimation of the external noise which presents a sensitivity index of more than 80%. The use of strategic noise mapping provides indoor level predictions with an uncertainty of ± 6 dB since it samples large areas where the noise can present oscillations with respect to mean value. Therefore, a direct assessment of the external noise levels measured in front of the façade of the building under investigation (2 m from the wall) is beneficial to improve the confidence on the acoustic KPI estimation.
The general procedure for the acoustic KPI calculation is based on the following steps:
The classes map used in the step (4) is reported in Figure 2
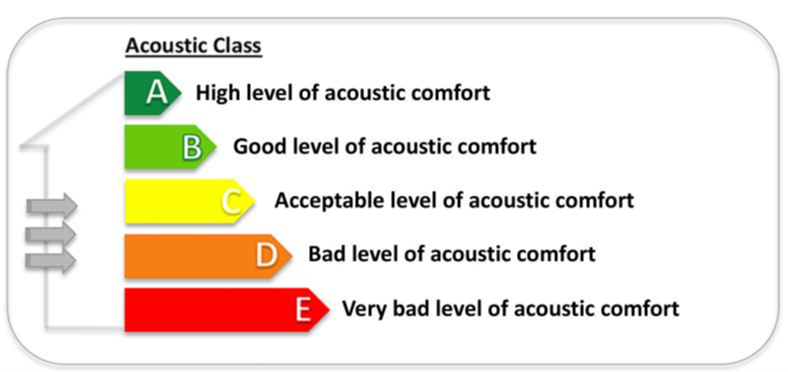
Figure 2 Building indoor acoustic comfort classes
The indoor acoustic comfort calculation process is described in Figure 3.

Figure 3 Indoor acoustic comfort calculation process map
The sequence of activities is:
The inputs are of two types:
The building data are:
District land use category: Countryside=1, Residential Area =2 or Urban Area =3
Room end use: Bedroom=1, Living room/Kitchen=2, Classroom=4, etc.
Room volume
Room floor area
Room shape: it defines the shape of the room façade in terms of balcony configuration as described in Figure 4.
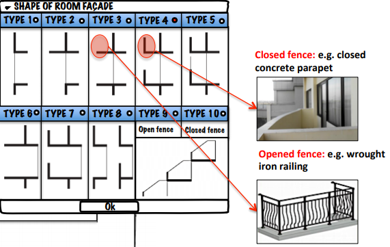
Figure 4 Room shape coding
Room floor level: numbering starts in 1 for the ground floor
Balcony width
Balcony material
Façade element types: wall =1, window =2, door =2, small element as ventilation grids =4
Element surface
Element sound reduction index (RW)
Walls layer thickness
Walls layer density
Demonstration case:
The indoor acoustic comfort calculation has been tested in the demo case located in Warmond in the Netherlands. Figure 5 represents the buildings tested.
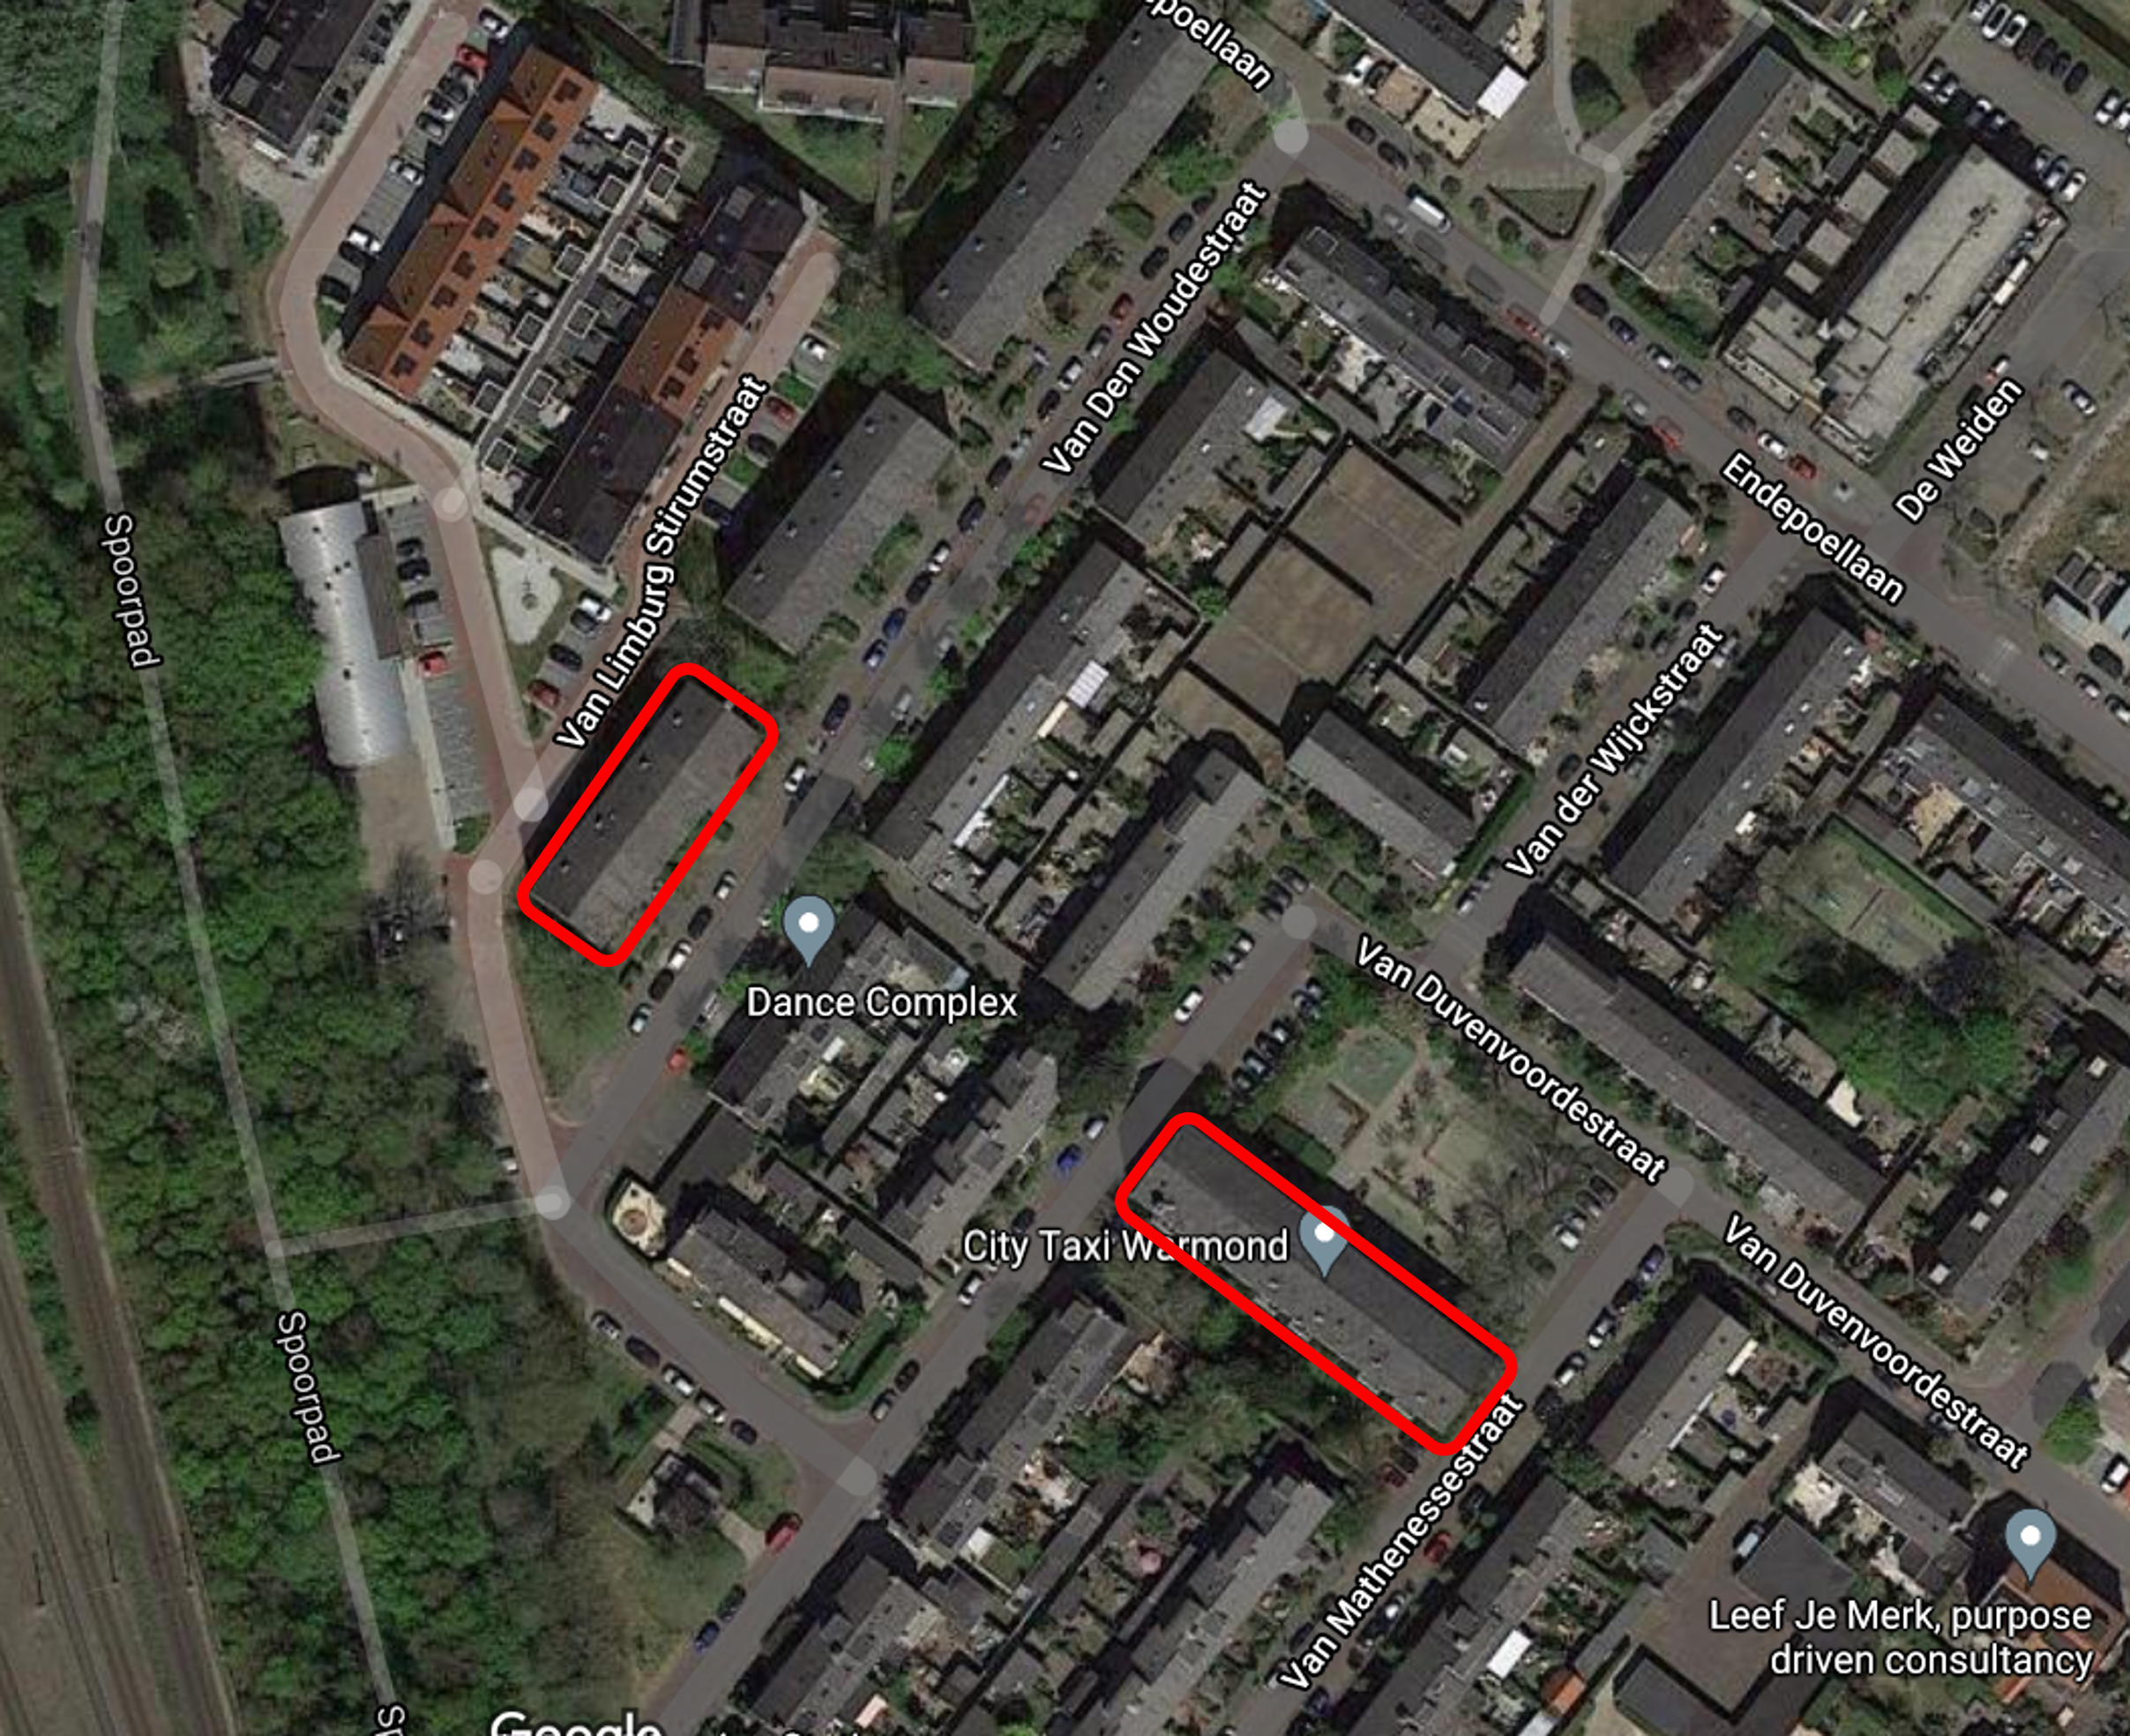
Figure 5 Building tested
In Figure 6 it is possible to observe the selected apartments.
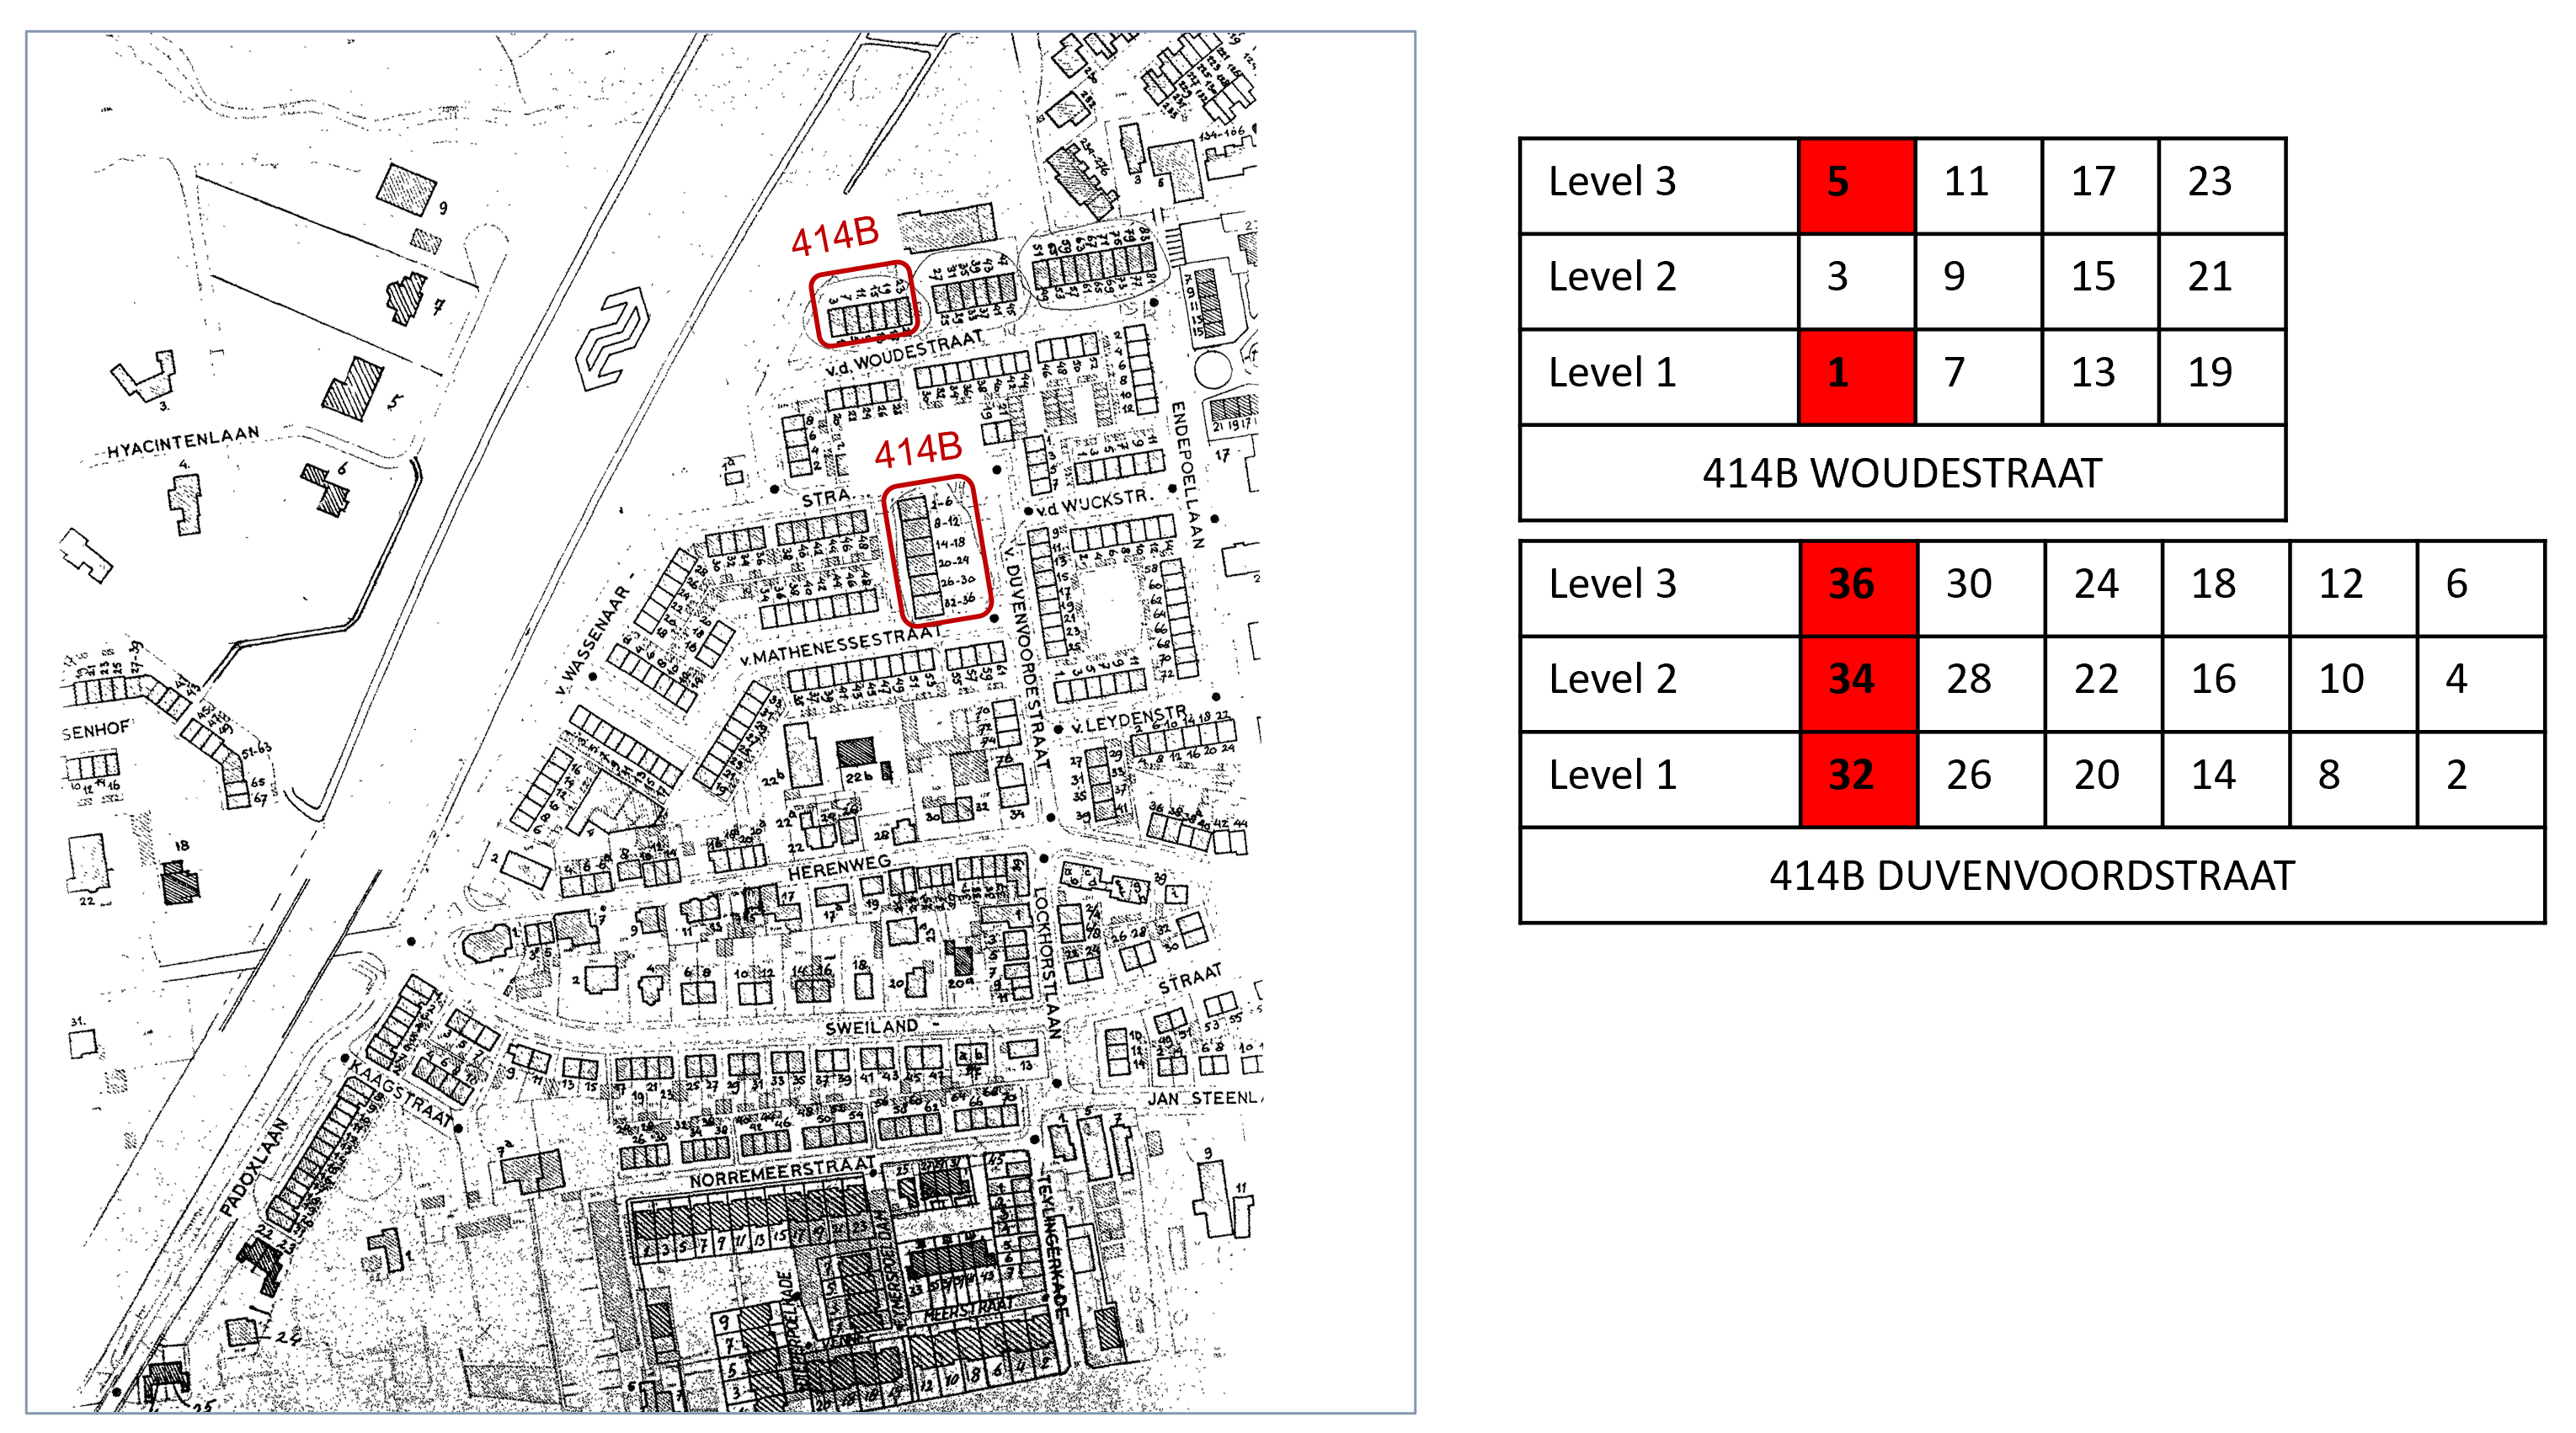
Figure 6 Selected apartments
RESULTS: Acoustic tests - Measurement of outdoor and indoor sound pressure level
The characterization of outdoor noise level is important since it represents the load that is responsible of the acoustic discomfort inside the dwellings. A monitoring of outdoor Sound Pressure Level (SPL) was performed with the aim to estimate typical levels in the zone of the demo cases during the day. The characterization of external noise is made in terms of two categories of sounds: continuous background noise and isolated single sound events. The continuous background noise is the base level typically present in the zone (e.g., industrial plant noise), while sporadic events are related to peak levels, which are concentrated in time (e.g., passage of road vehicles or trains, roadworks etc.). The peak levels are measured with Instantaneous A-weighted SPL LA (1 s), while the continuous noise level is measured with A-weighted Equivalent SPL LAeq over 30 s. The latter represents the level of an ideal continuous and constant sound which has the same energy of the measured 30 s of sounds. In the following figures, the final value of a LAeq curve is the integration over the whole period. Two monitoring microphones were installed in 414B WOUDESTRAAT, as depicted in Figure 7.
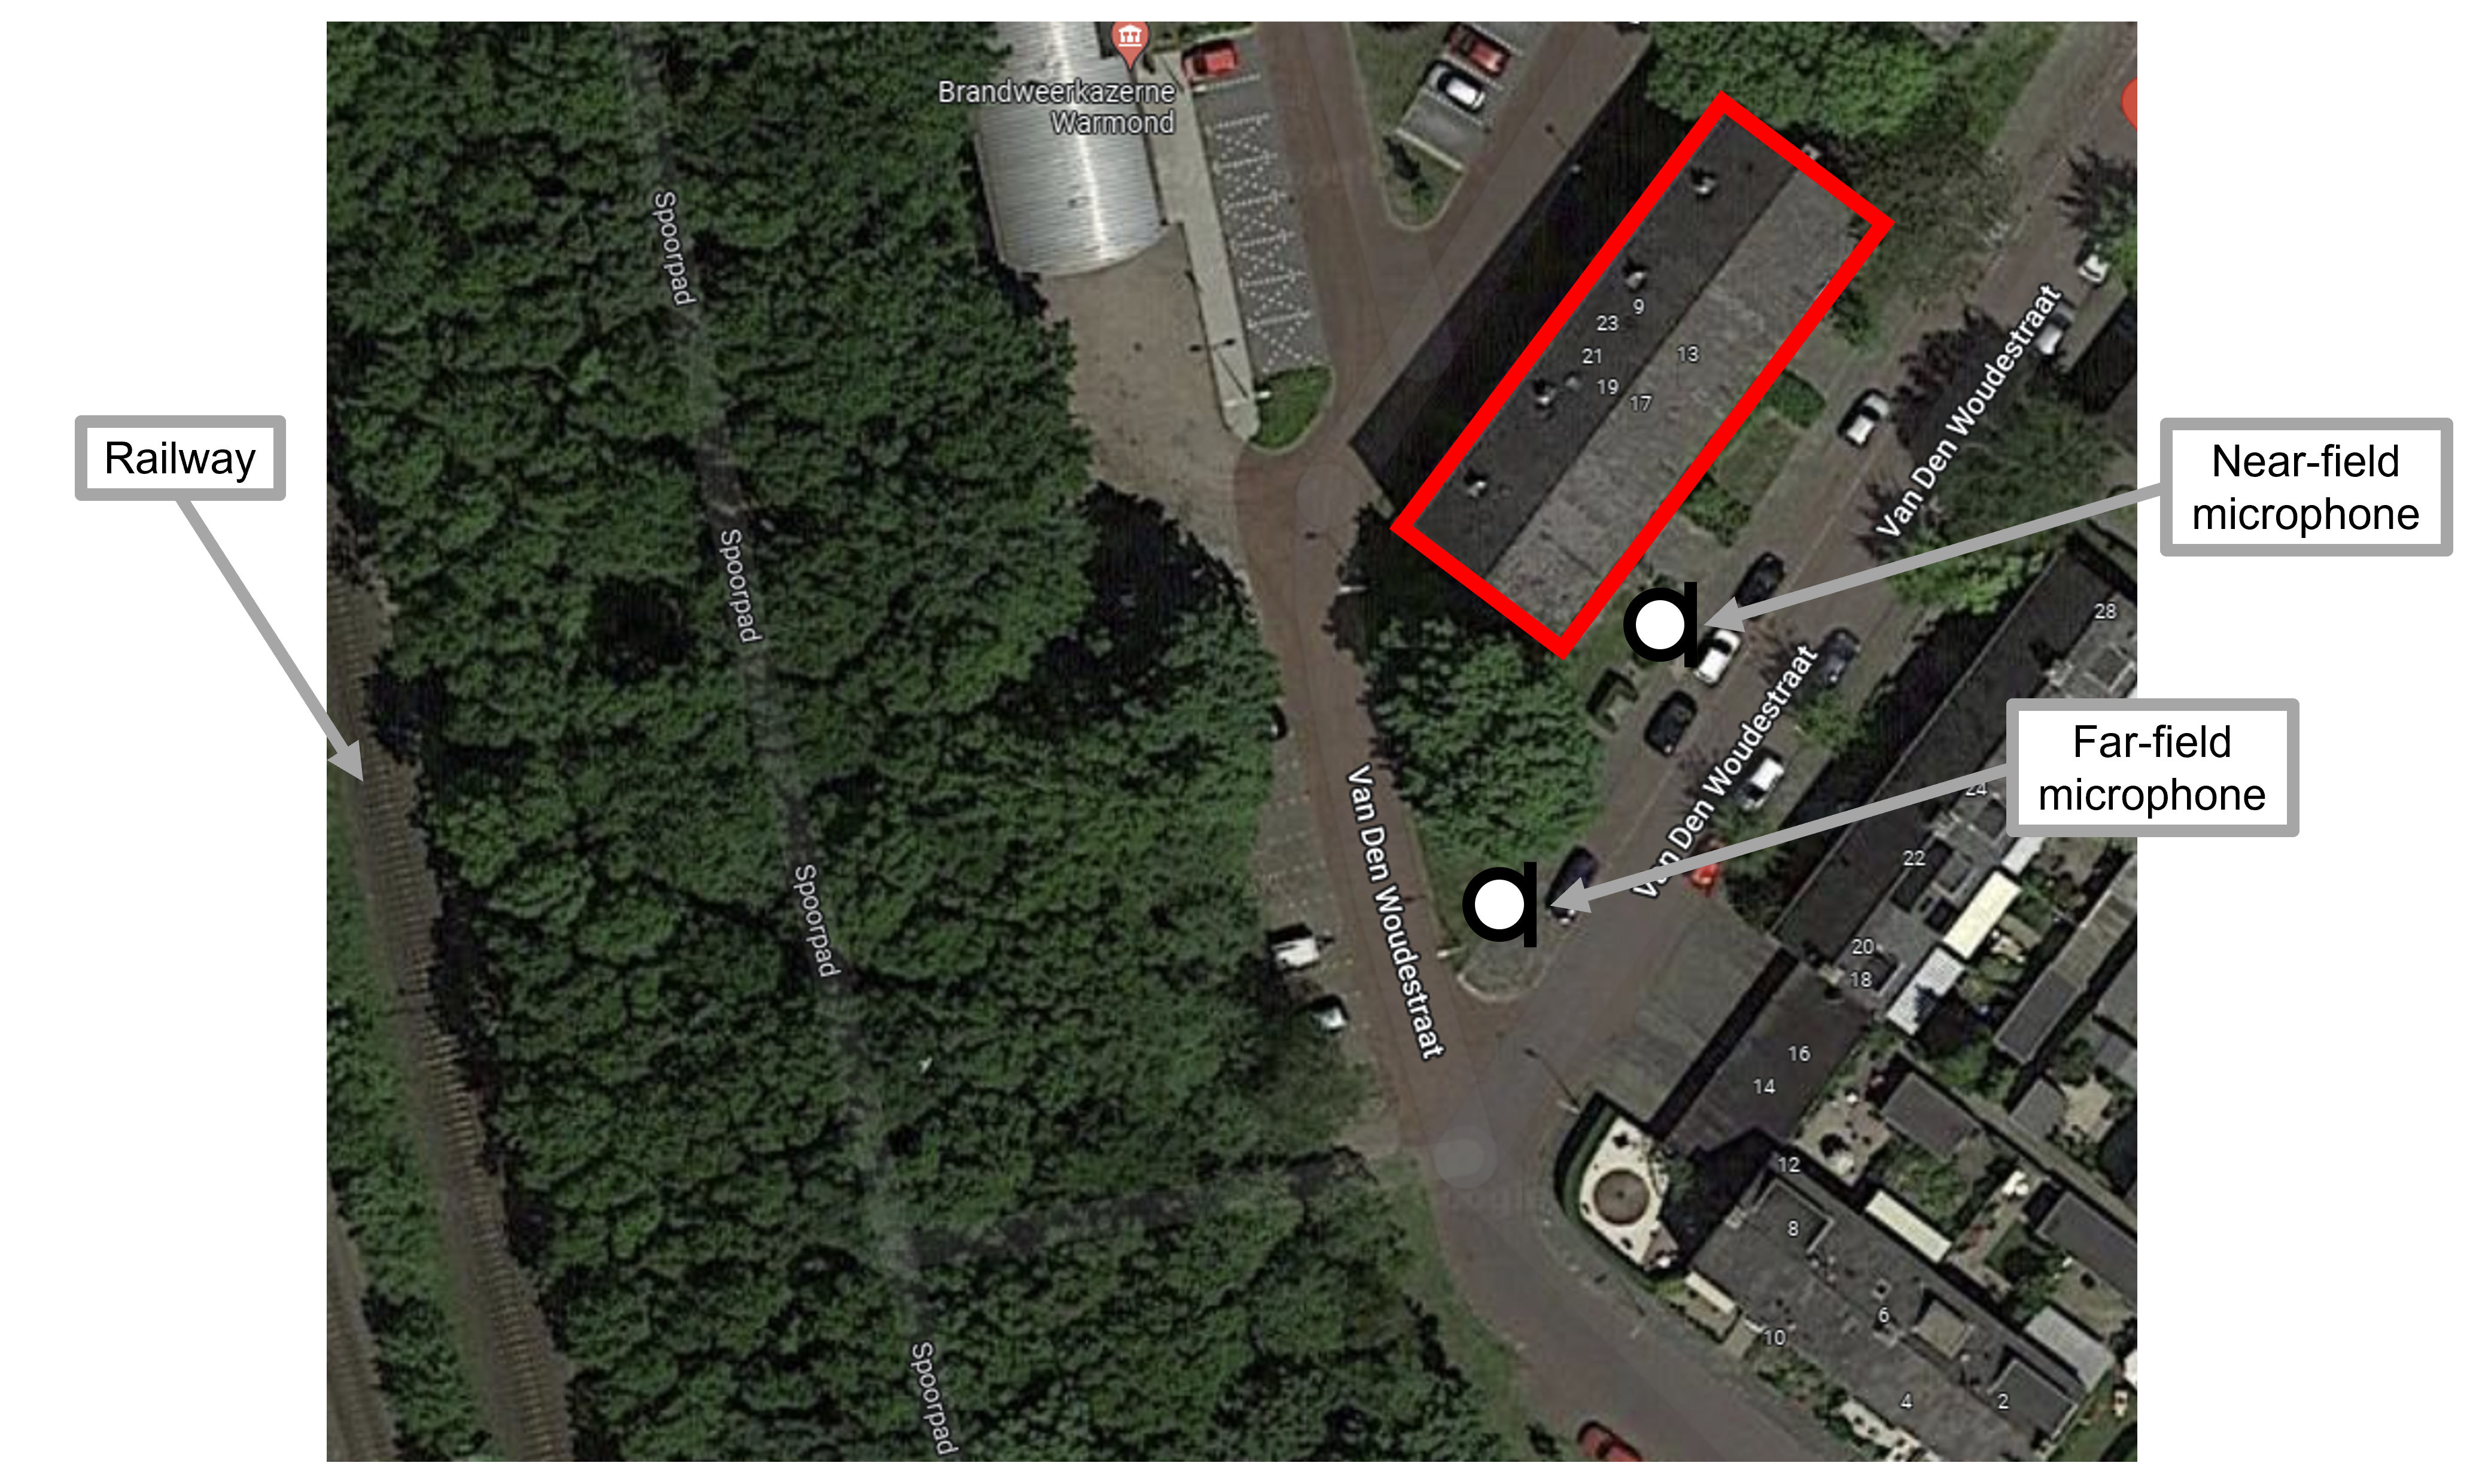
Figure 7 Exterior noise measurement locations for 414B WOUDESTRAAT demo case
A near-field microphone is placed 2 meters far from the façade of the building in front of the apartment 1 (ground floor), while a far-field microphone is installed in free-field, to characterize the noise level avoiding the masking caused by obstacles. The far field monitoring is also meaningful for apartment 5.
Far-field measurements are compared with the strategic noise mapping of the town depicted in Figure 8. Strategic noise mapping does not provide an exact value for each exposed room façade, since it should be measured at 2 m from the façade for the model adopted, but only a representative value of the entire area. Therefore, the actual noise level can be different from a façade to another. For this reason, an uncertainty equal to ± 5 dB(A) is considered for the strategic noise mapping.
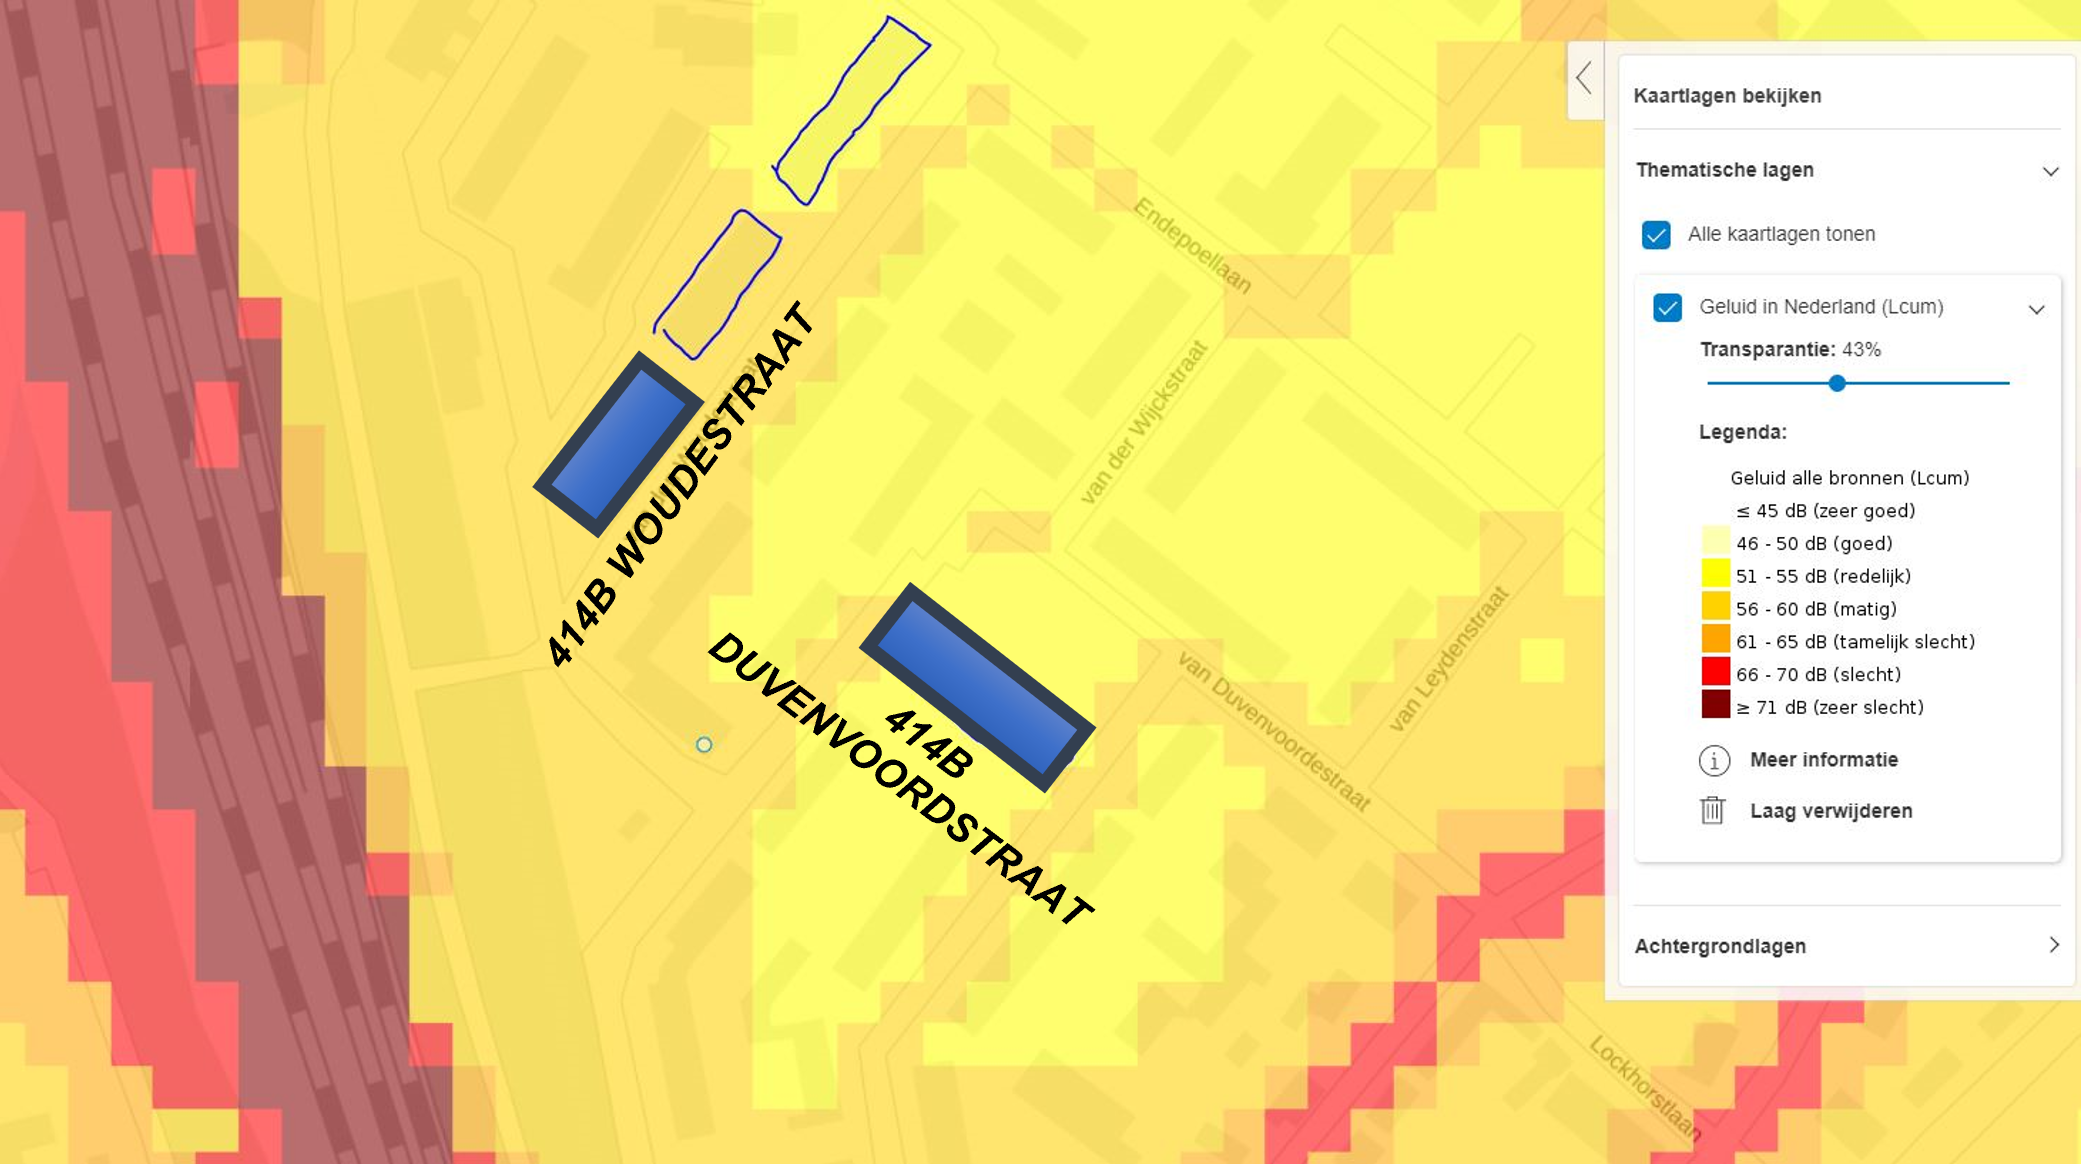
Figure 8 Strategic noise mapping in dBA. In blue the demo buildings
Figure 9 shows the outdoor level measured in 414B WOUDESTRAAT with the far-field microphone in a quiet condition, i.e., in the early morning without traffic, train noise etc., hence, it represents an optimistic estimation of outdoor background noise. In this condition, the level is constantly around 40 dB(A), while the strategic noise mapping suggests a level of 56-60 dBA for this area. More typical daily conditions are depicted in Figure 10, Figure 11, Figure 12 and Figure 13, where different sporadic noise sources occur, such as moderate traffic, one or more train passages and road sanitation working nearby. In such conditions, the strategic noise mapping is more representative of measured noise levels. Figure 14 shows an example of noise caused by a technician that is operating close to the apartments (about 10 meters). It is noticeable that the sounds are loud since the source is near the monitoring microphone, but they have short time duration. The peaks are related to closing the doors after taking the tool kits from the van.
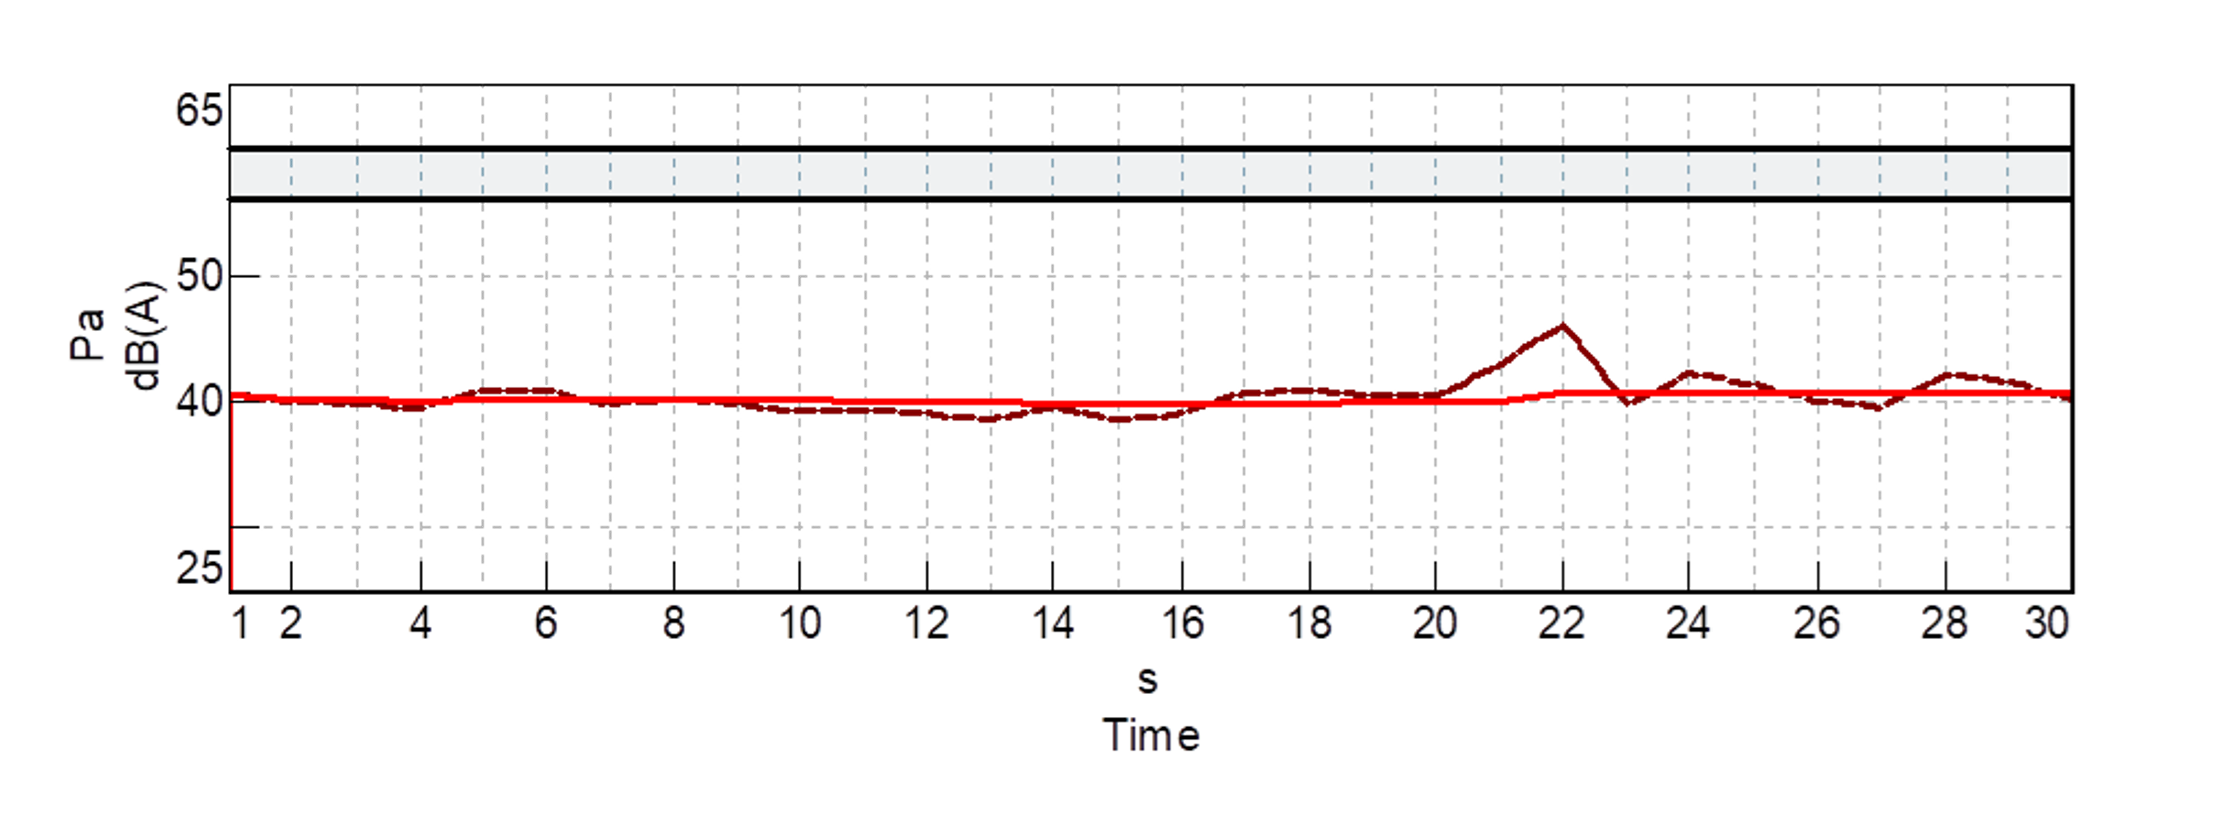
Figure 9 Outdoor LAeq (in red) and LA (in brown) measured in 414B WOUDESTRAAT with far-field microphone.
Grey range is the level provided by strategic noise mapping. The baseline background level measured in early morning without significant sources of sporadic noise. This can be considered an estimation of the optimistic (lowest) background level.
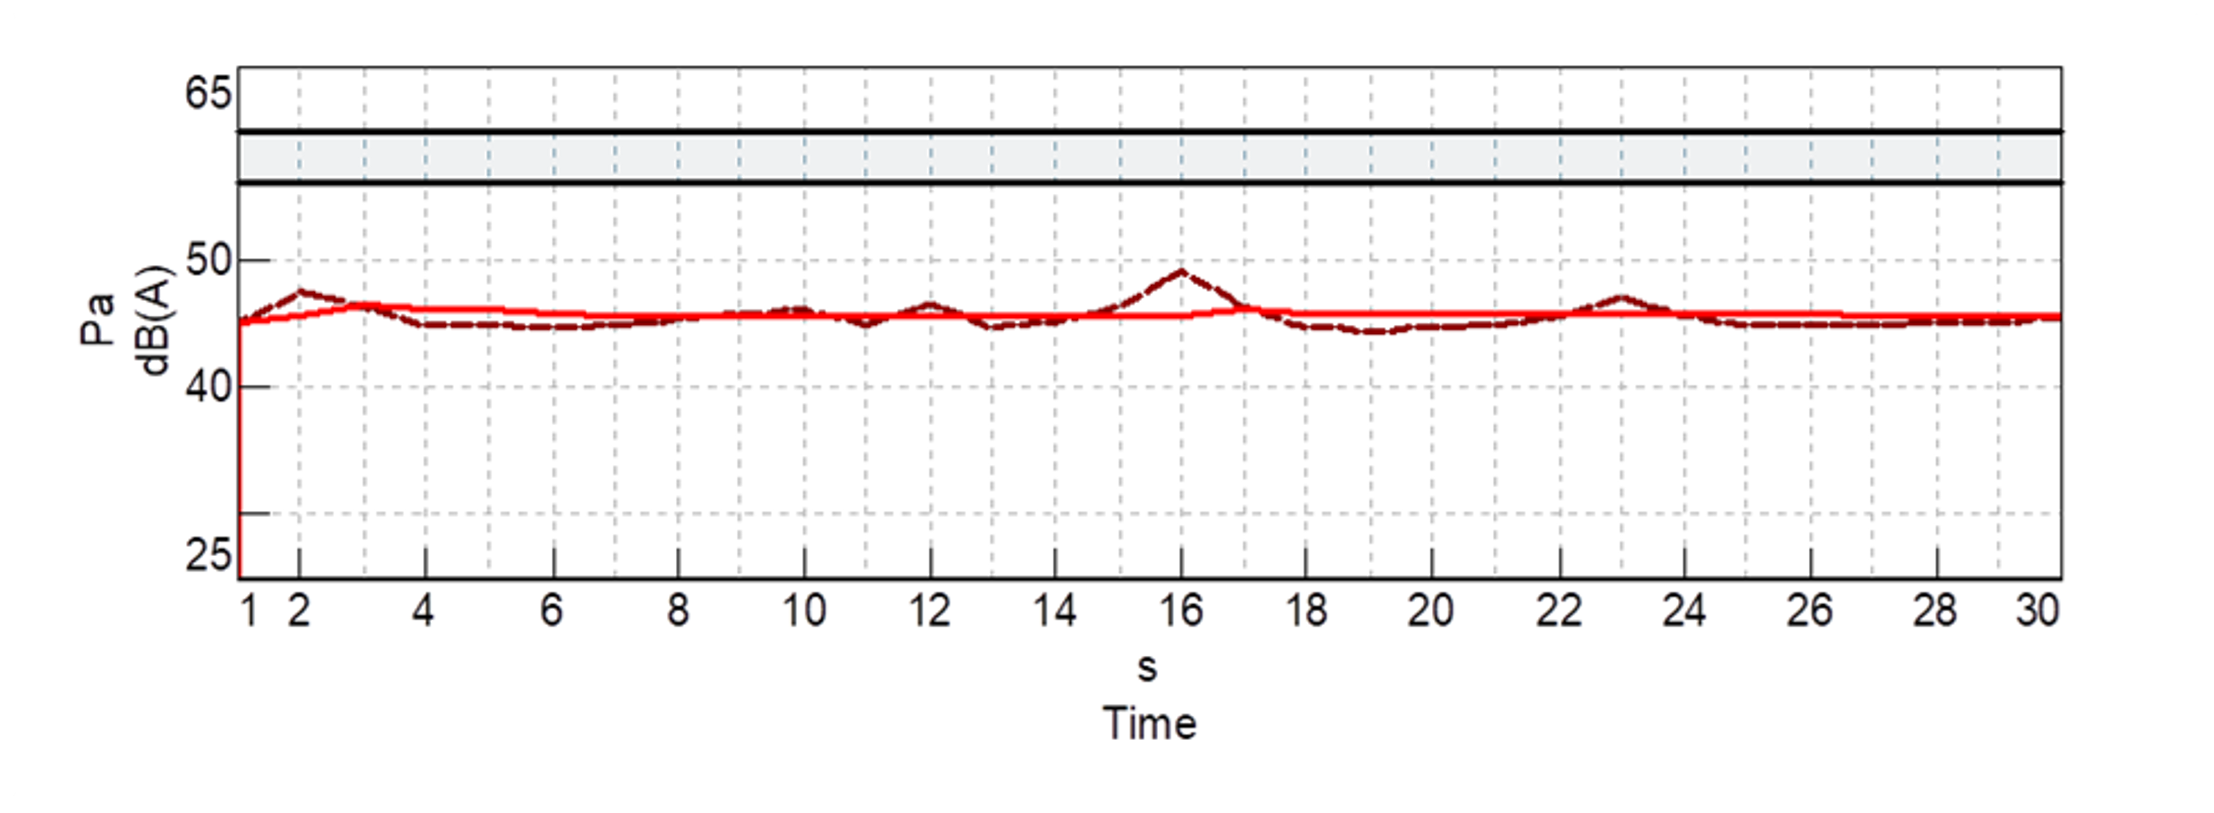
Figure 10 Outdoor LAeq (in red) and LA (in brown) measured in 414B WOUDESTRAAT with far-field microphone.
Grey range is the level provided by strategic noise mapping. This measurement is taken in a moderate traffic condition and represents an example of typical daily condition of continuous outdoor noise.
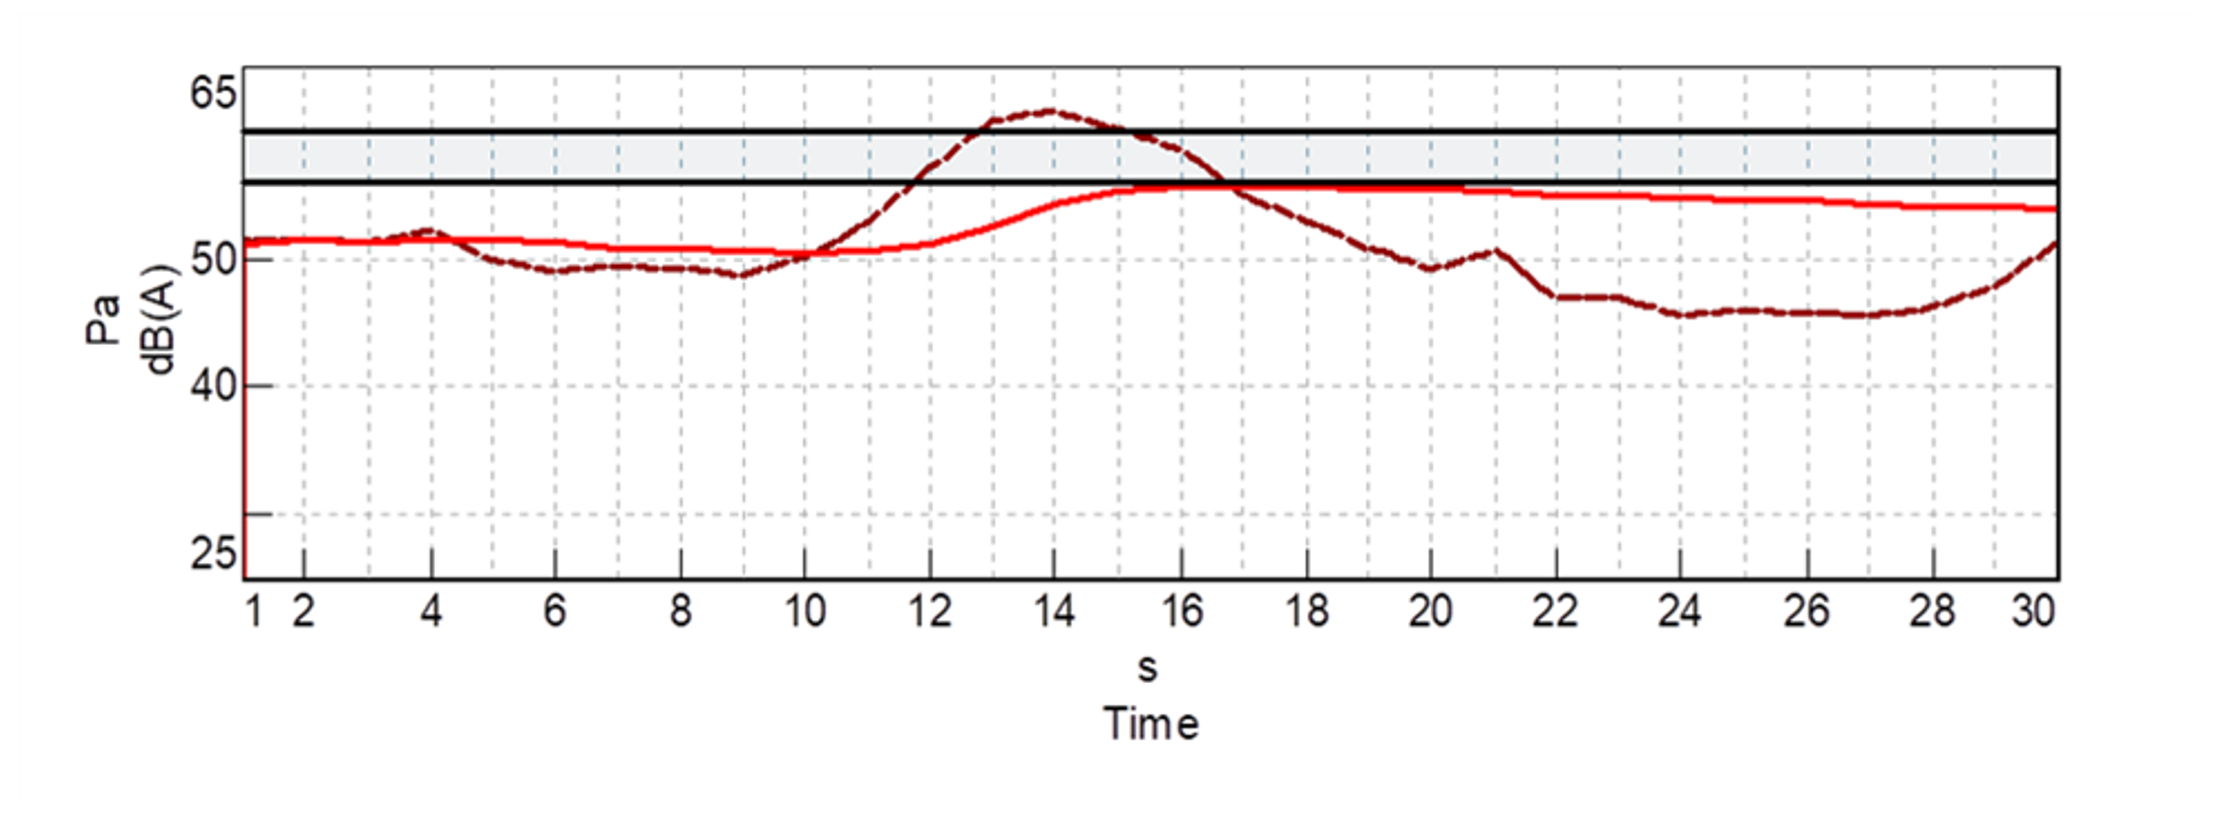
Figure 11 Outdoor LAeq (in red) and LA (in brown) measured in 414B WOUDESTRAAT with far-field microphone.
Grey range is the level provided by strategic noise mapping. This measurement is taken in a moderate traffic condition and a passage of a train on the railway This case represents an example of outdoor sporadic noise in presence of typical level of continuous noise which is one of the most likely cases during daytime.
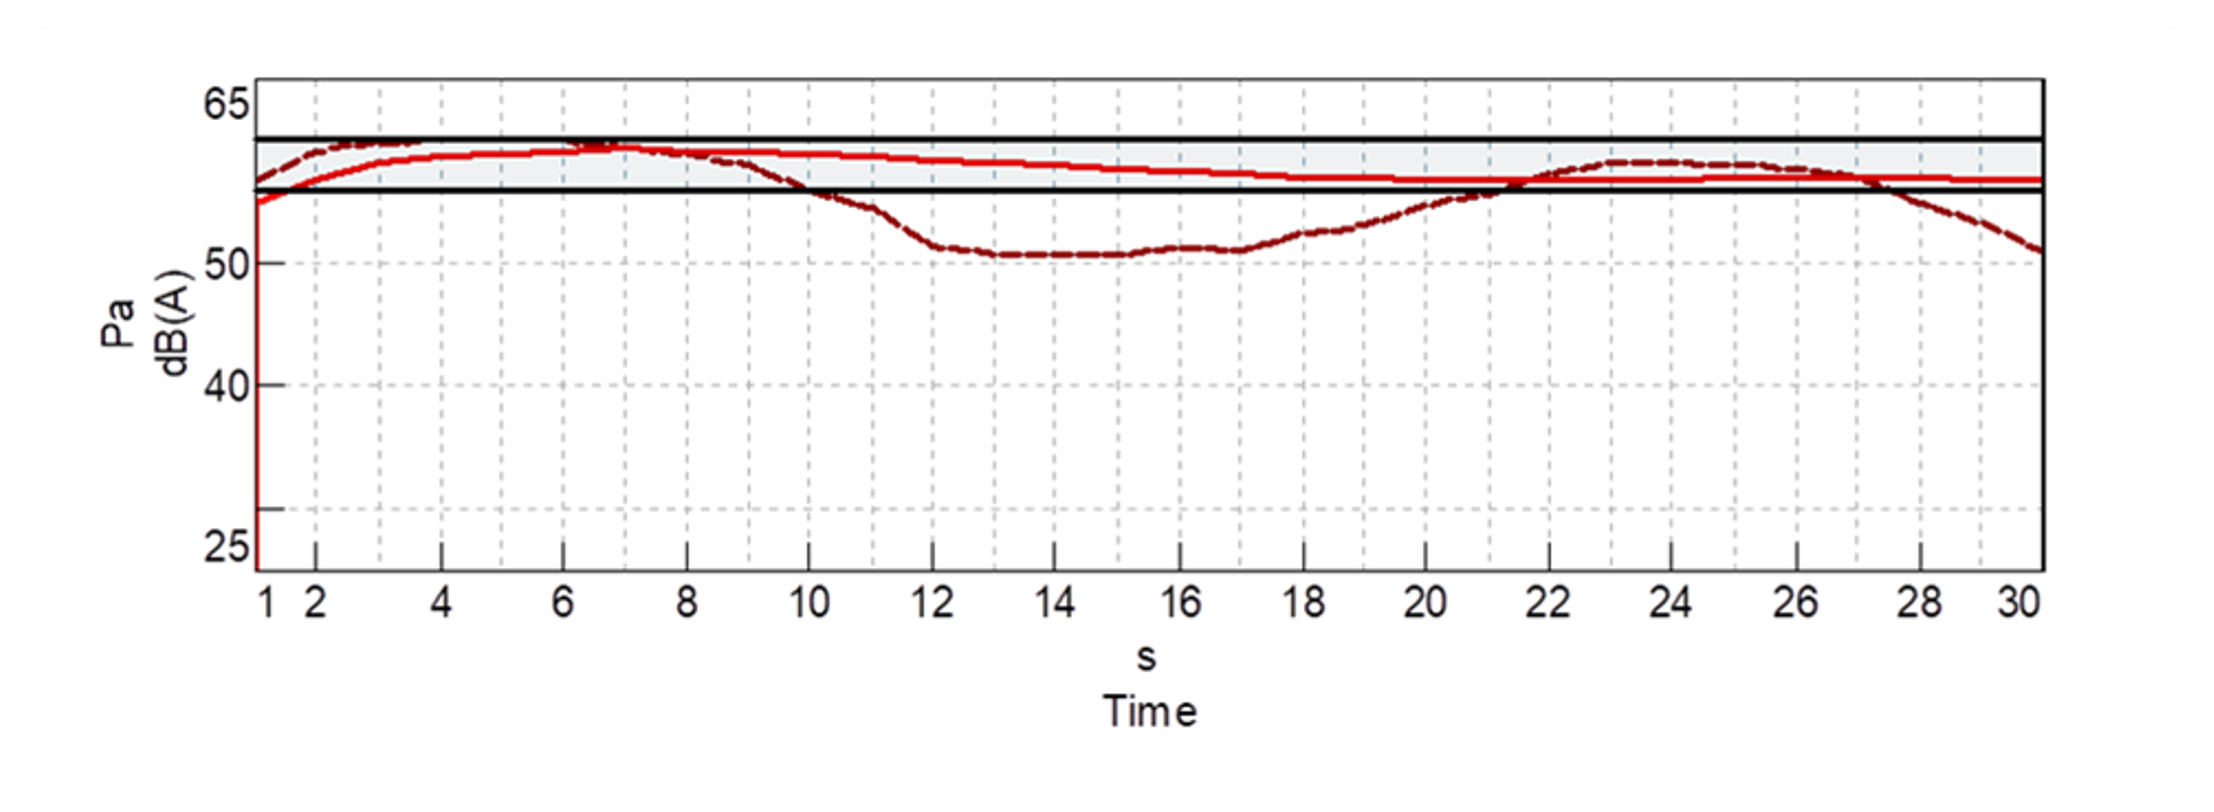
Figure 12 Outdoor LAeq (in red) and LA (in brown) measured in 414B WOUDESTRAAT with far-field microphone.
Grey range is the level provided by strategic noise mapping. This measurement is taken during the passage of two consecutive trains on the railway. This represents an example of annoying sporadic outdoor noise since the train passage is a regularly occurring event during daytime.
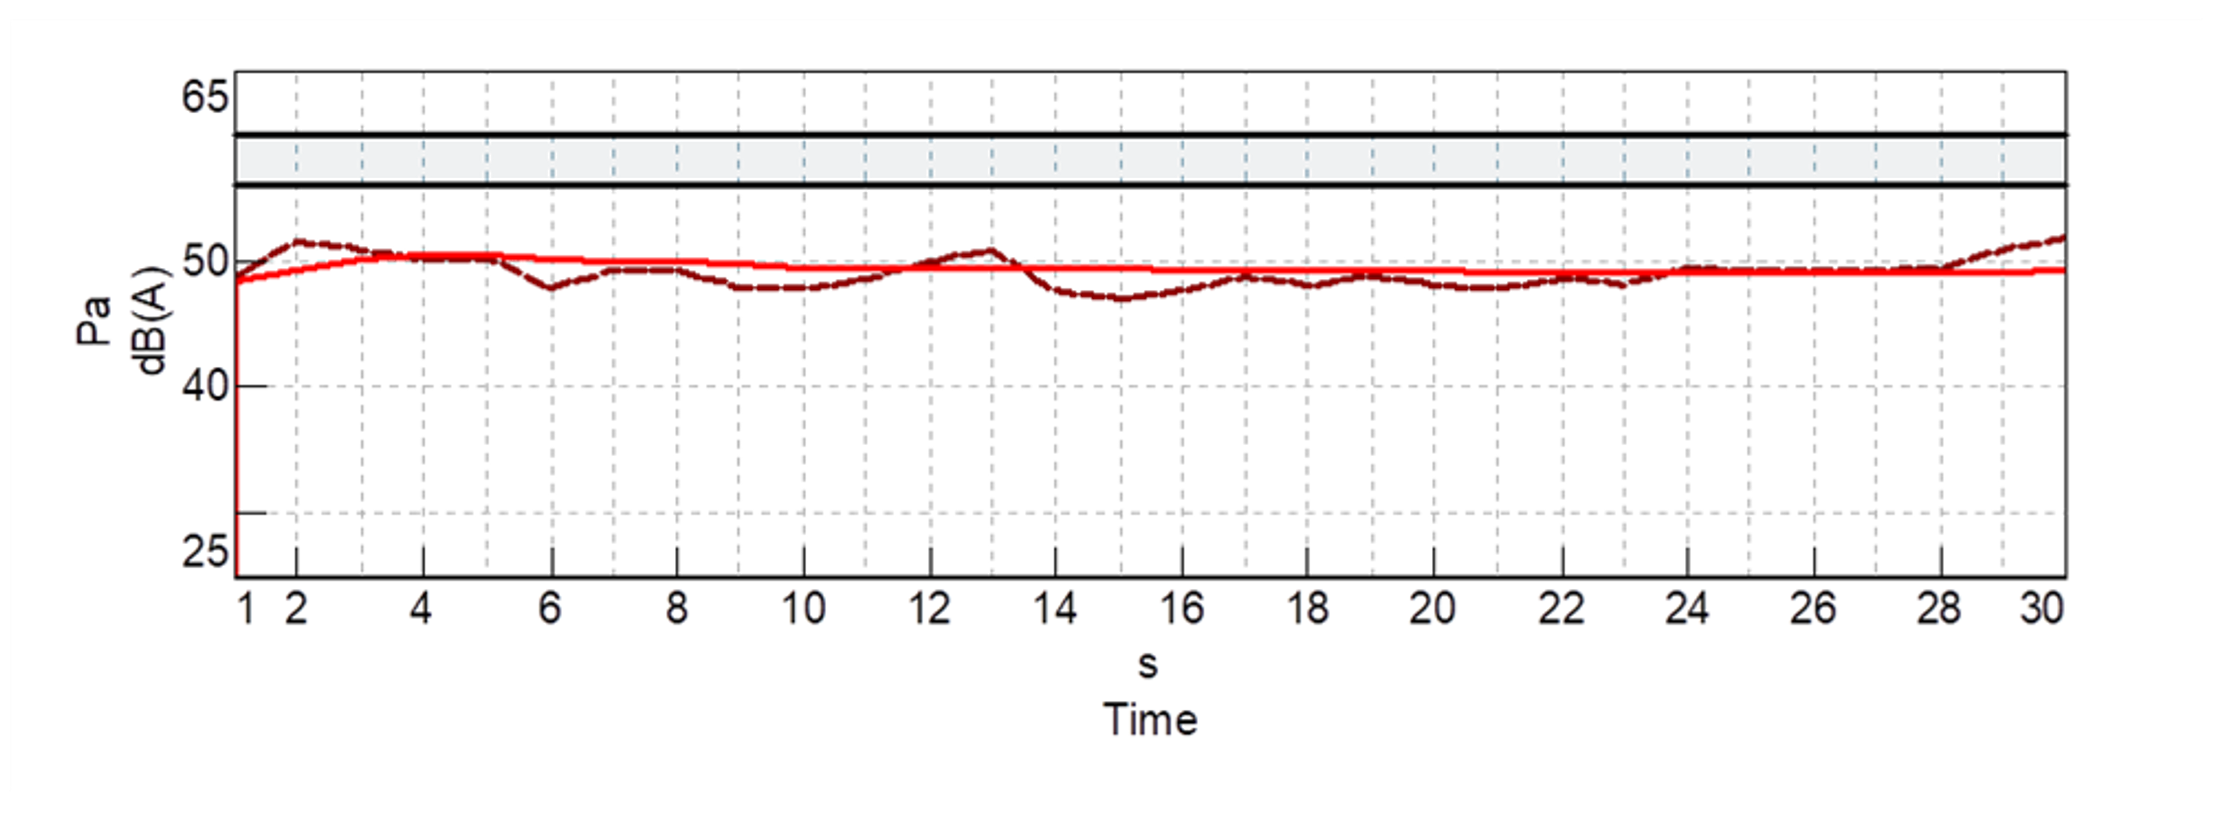
Figure 13 Outdoor LAeq (in red) and LA (in brown) measured in 414B WOUDESTRAAT with far-field microphone.
Grey range is the level provided by strategic noise mapping. This measurement is taken during the passage of road sanitation (about hundred meters far from the apartments) which represents an example of typical daily condition of continuous outdoor noise. This kind of noise generally occur on weekly basis.
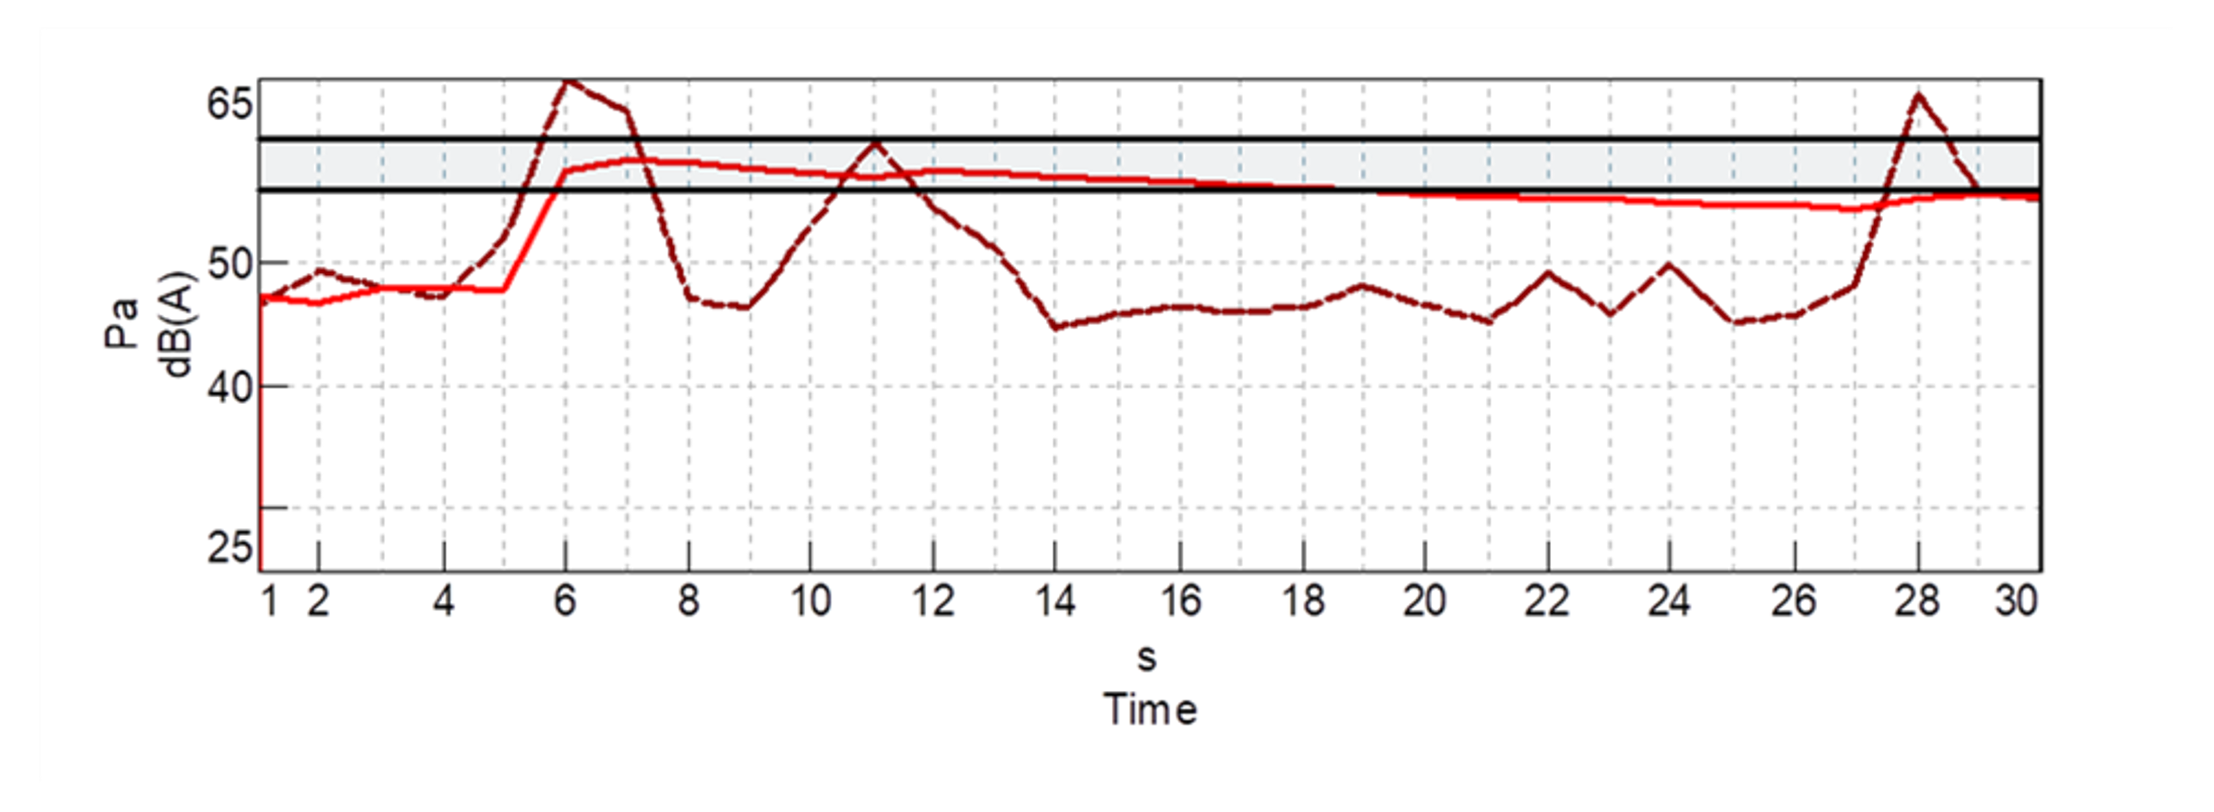
Figure 14 Outdoor LAeq (in red) and LA (in brown) measured in 414B WOUDESTRAAT.
Grey range is the level provided by strategic noise mapping. This measurement is taken during the operations of a technician taking tools from the van (about 10 meters from the apartments). This is an example of high-level sporadic noise not occurring with a regular time basis
Some of these outdoor noises occur on regular time basis, such as traffic noise, train passage, road sanitation and so on, while other types of noise occur in non-predictable moments. The monitoring presented here is not intended to comprehensive of all possible cases, but it is representative of typical daily conditions for the demo case.
As regards indoor levels, Figure 15 depicts the measurement setup with the outdoor nearfield microphone at 2 m from the façade and 5 microphones inside the room, randomly distributed (at least 0.7 m from the walls).

Figure 15 Scheme of measurement setup for indoor vs outdoor level monitoring
Figure 16 shows the background noise level inside the apartment 1, which is at the first floor compared with near-field microphone. It is worth noticing that, in this case, the indoor level is not meaningfully affected by outdoor noise. This means that the contribution from outdoor noise is below the background level of indoor noise. This aspect must be considered in the evaluation of the estimated indoor level, hence the acoustic comfort.
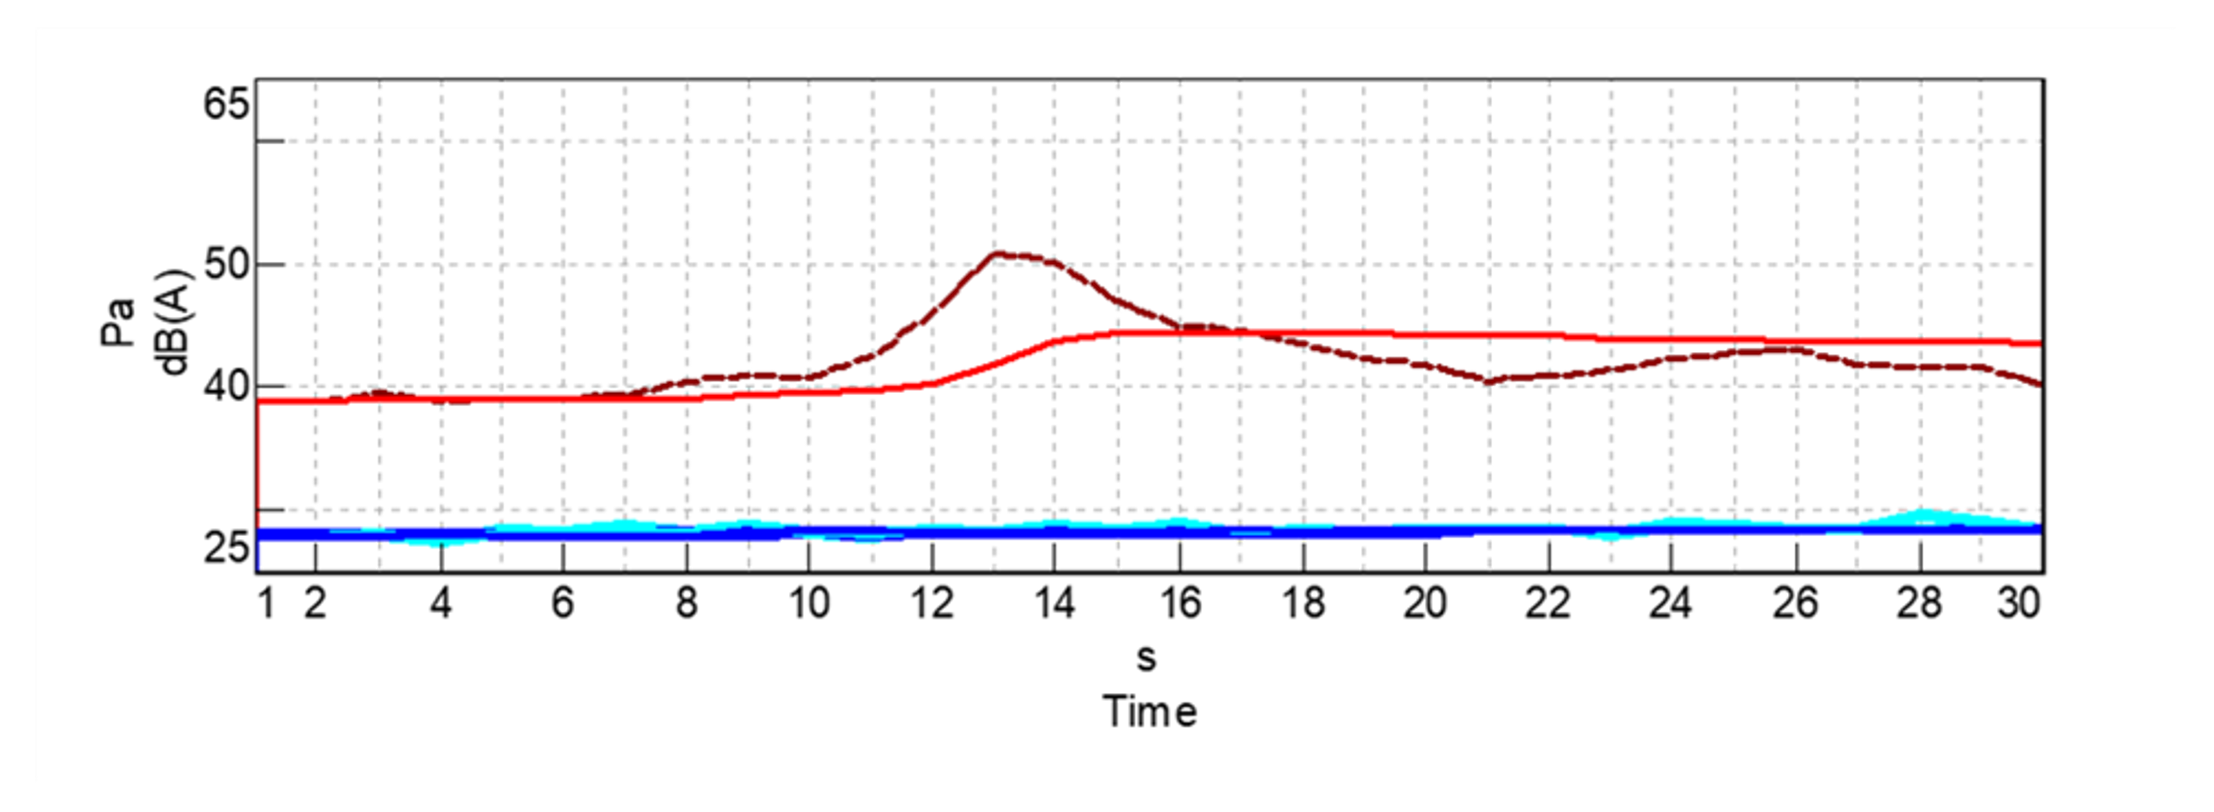
Figure 16 Outdoor versus indoor level measured in apartment 1.
Outdoor LAeq (in red) and indoor LAeq (in blue). Outdoor LA (in brown) and indoor LA (in cyan). Outdoor level is measured with near-field microphone in low noise condition with a car passing on the road near the apartment
The other demo case is in 414B DUVENVOORDSTRAAT. In this case, the strategic noise mapping suggests a range of 51-56 dB(A) for this area. The monitoring of the outdoor noise in typical daily condition confirms this value, as depicted in Figure 17. It must be noted that the building is very close to a park for children. The monitoring in apartment 36, showed in Figure 18, reveals a great influence of the children noise inside the apartment.
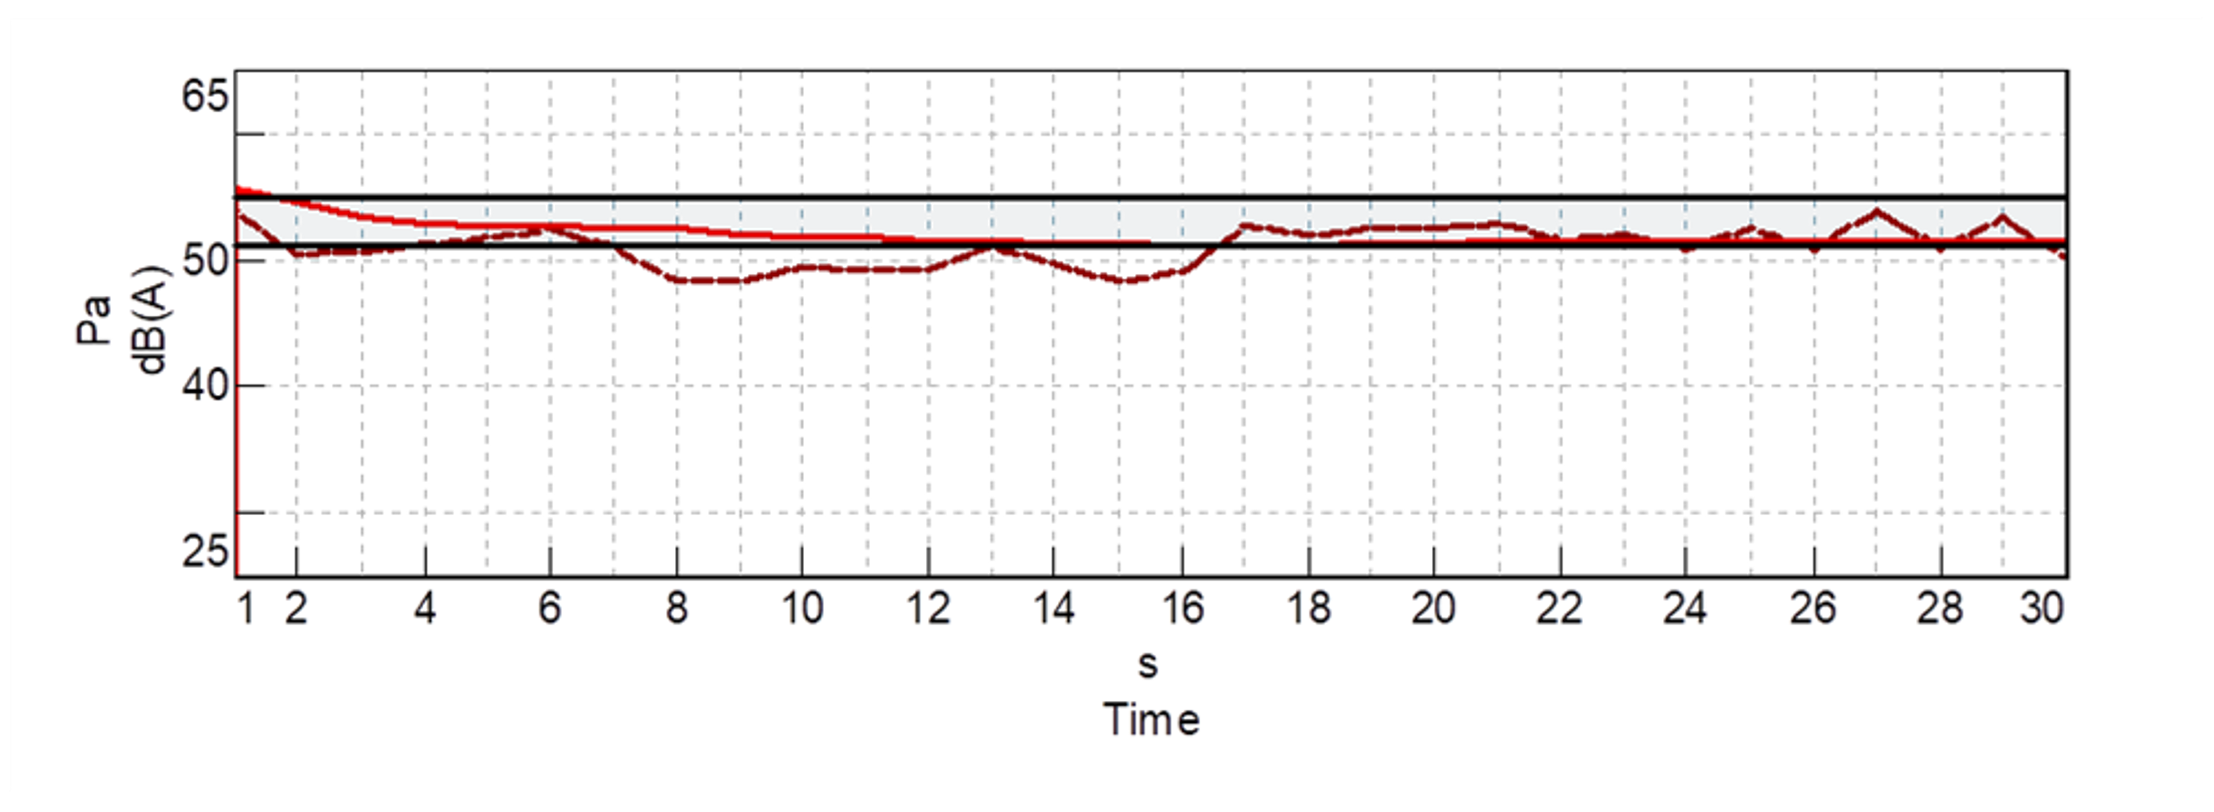
Figure 17 Outdoor LAeq (in red) and LA (in brown) measured in 414B DUVENVOORDSTRAAT.
Grey range is the level provided by strategic noise mapping. This measurement is taken with near-field microphone in a typical daily condition.
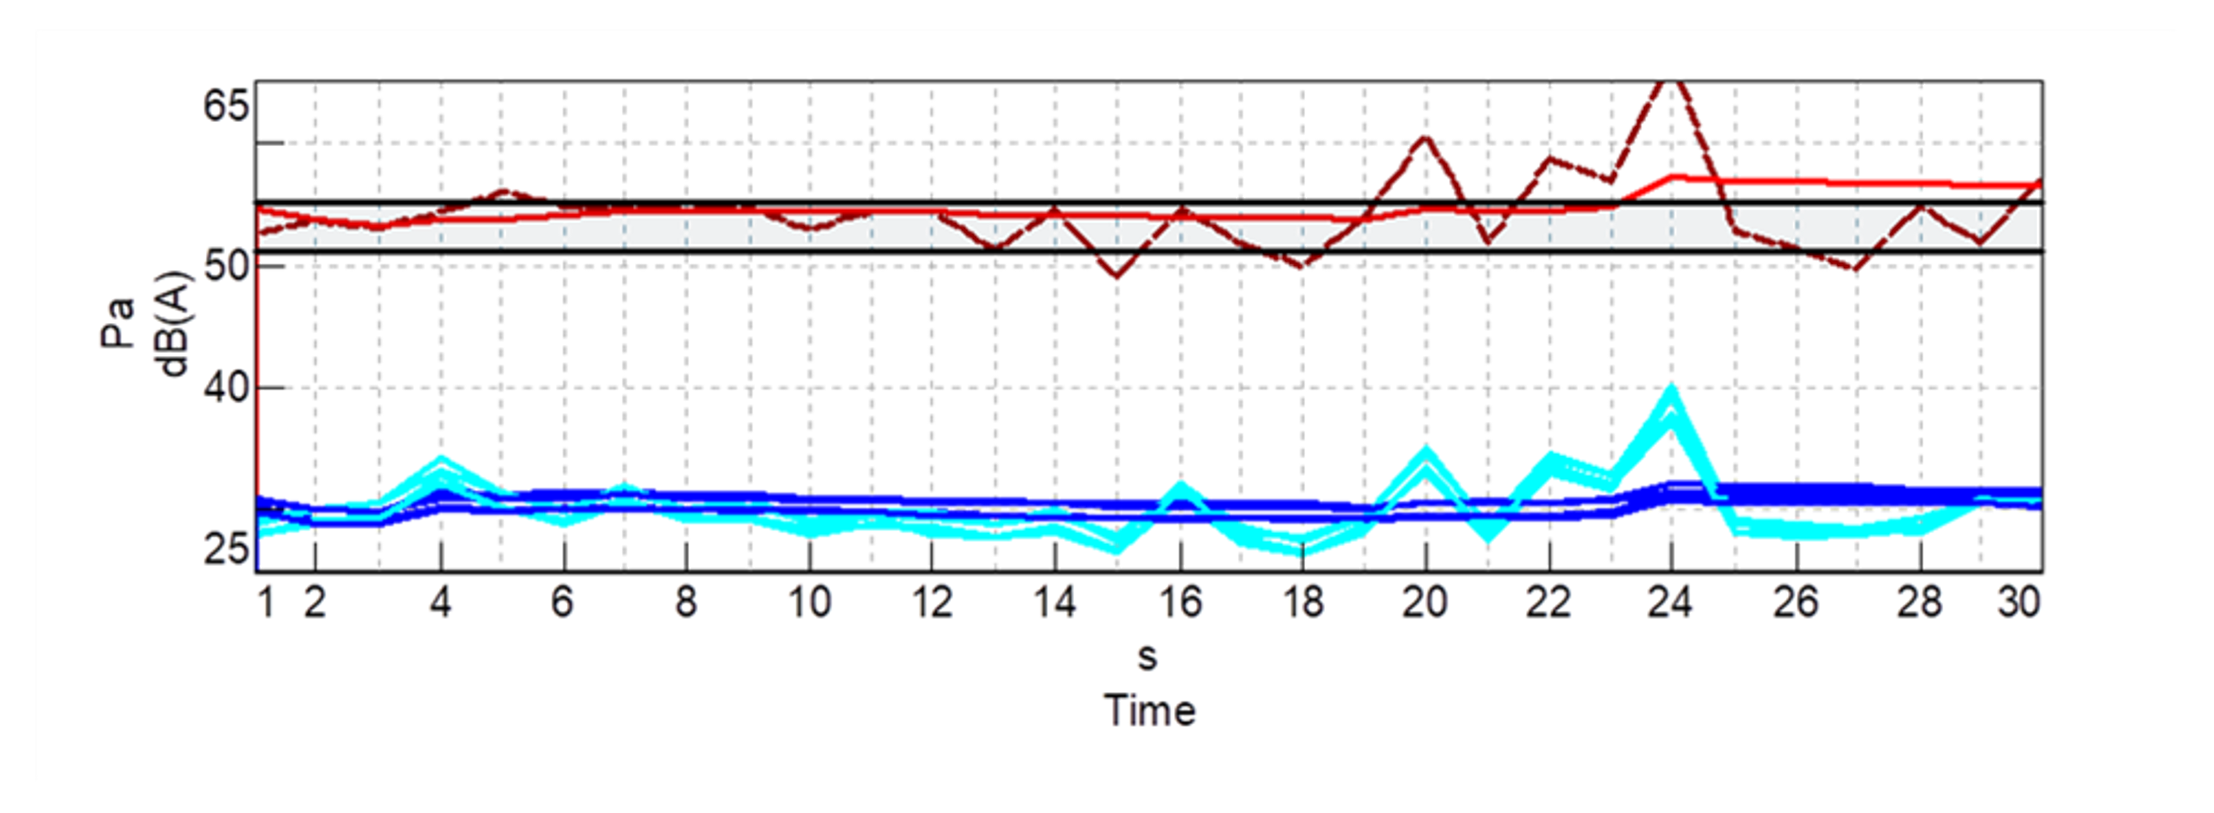
Figure 18 Outdoor versus indoor level measured in apartment 36
Outdoor LAeq (in red) and indoor LAeq (in blue). Outdoor LA (in brown) and indoor LA (in cyan). Outdoor level is measured with near-field microphone while children were shouting and playing basketball. This represents a noise source frequently occurring in daytime.
In conclusion, the monitoring of outdoor noise confirmed that the strategic noise mapping is representative of average daily noise level. However, it must be considered that sporadic noise may produce higher peak levels for a short time, while in some time windows the external noise level could be lower. In addition, it must be stated that the noise mapping is representative of the zone, but it is not the exact acoustic load for a specific façade. Lastly, the outdoor noise can be neglected when it causes an indoor level below the indoor background noise.
KPI CALCULATION BY MEANS OF THE INDOOR ACOUSTIC COMFORT CALCULATION TOOL
The indoor acoustic comfort calculation tool has been exploited to calculate the acoustic class of the building located at 414B Woudestraat (refer to Figure 5 and Figure 6).
The inputs for the calculation are the following:
2. The building data such as room dimensions (Figure 19), room use (Figure 20), geometry and material of the façade components, walls (Figure 21) and windows (Figure 22), small element dimension, outside shape of the façade. All those data are retrieved from the BIM of the building. The Figure 19 to Figure 22 demonstrate a clear visualisation of the process within a BIM model.
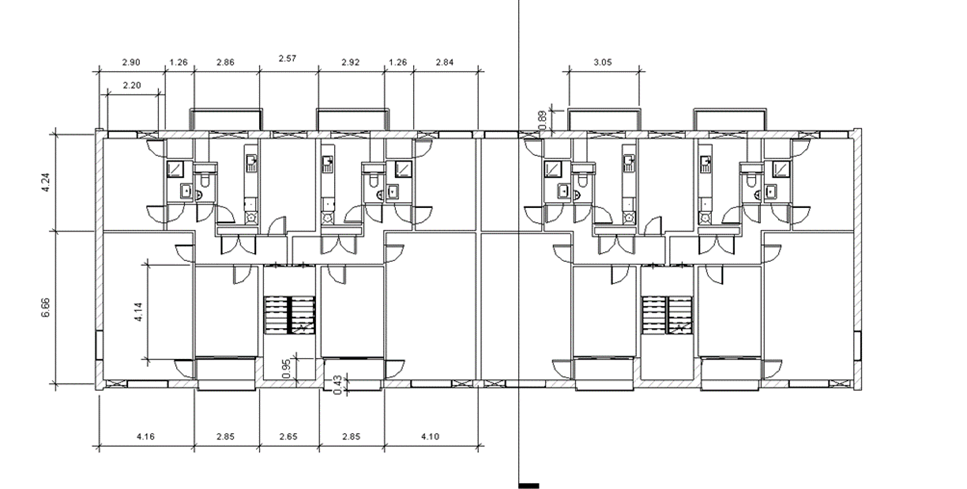
Figure 19 Room dimensions
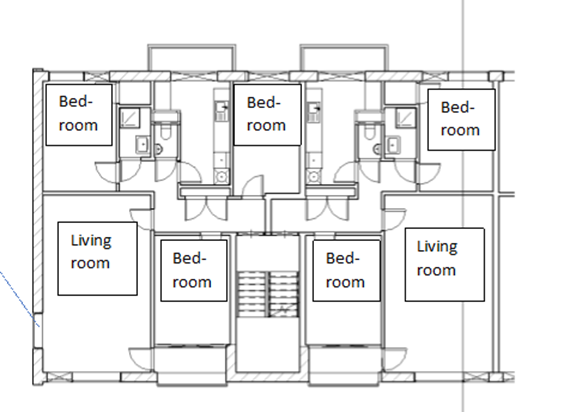
Figure 20 Room use
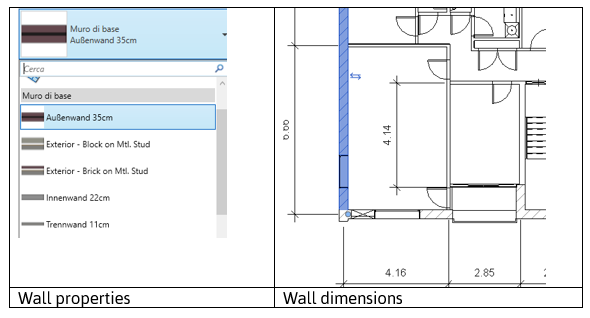
Figure 21 Wall properties (density and thickness of all layers)
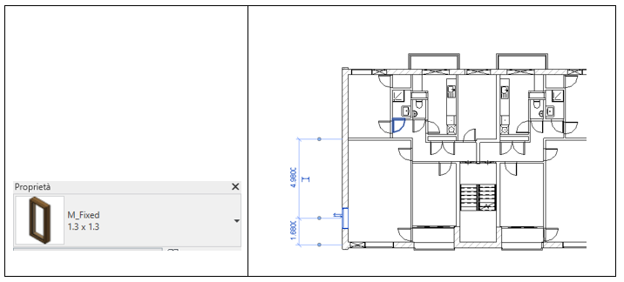
Figure 22 Windows dimensions and materials
The tool will calculate the following outputs:
The outputs calculated for the building located at 414B Woudestraat for the rooms 1 to 7 are reported in Table 2. The room and room façade numbering for two different floors of the building are shown in Figure 23. The weighted sound reduction Rw calculated using equation 2 for each room façade is ranging from 28 (for room with large windows) to 59 dB(A) (for rooms without windows). Those values are indexes of good acoustic performance of the building façade. This is confirmed by the equivalent continuous sound pressure level inside each room bordering to the external environment, estimated by equation 5, which ranges from 30 to 35 dB(A). If comparing those levels to the limits prescribed by the standards (see Table 1) each room can be ranked in class A and the same goes for the building. The building KPI is therefore 100%.
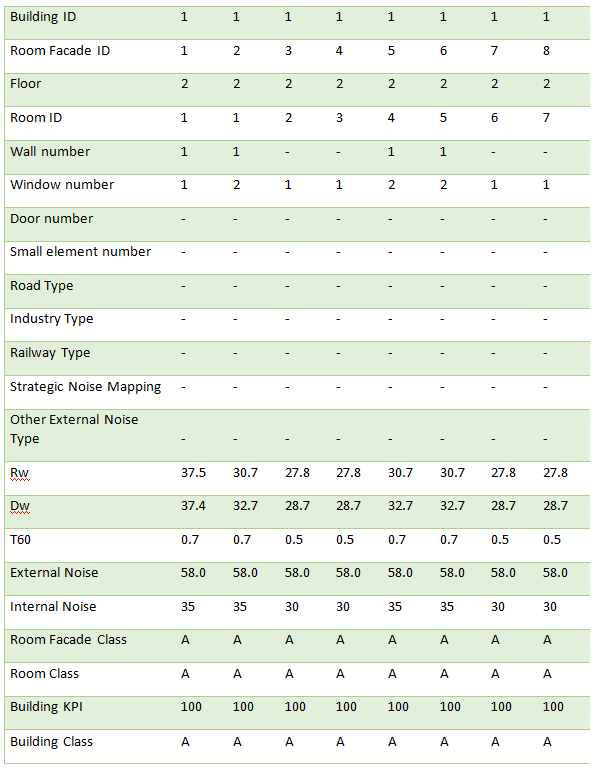
Table 2 Acoustic calculator outputs
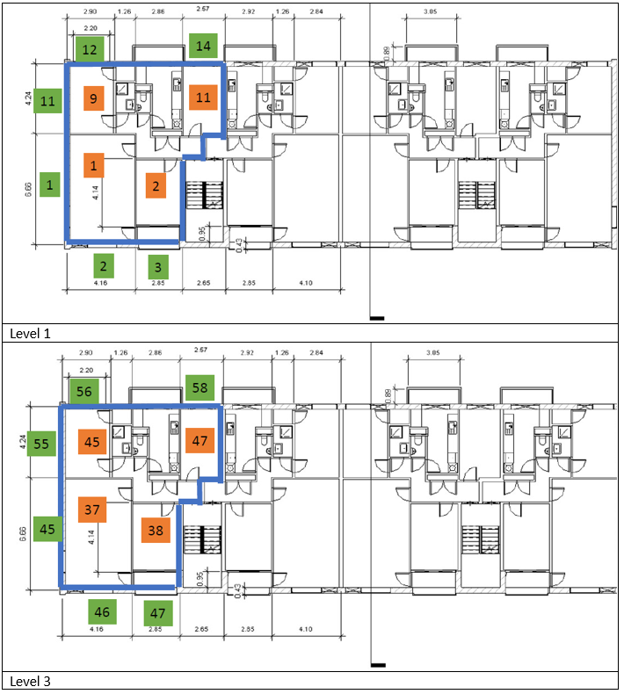
Figure 23 Room and room façade numbering (top, level 1 and bottom, level 3). Numbers in green represent the room facades, numbers in orange represent the rooms
SIMULATION OF RENOVATION SCENARIOS
In the previous section it has been shown that the building under analysis performs in Class A if using as external noise level the one retrieved from the strategic noise map (58 dB(A)). However it should be considered that during the day, even if sporadically, the level of external noise may exceed 58 dB(A), as it is the case when children play basketball in the parc nearby and the external noise has peaks up to 65 dB(A), see Figure 18.
If the calculation of the acoustic comfort KPI is repeated for different values of external noise, from 55 to 80 dB(A), the KPI decreases as shown in Figure 24 by the blue line. When the external noise is at 65 dB(A) (gray dashed vertical line) the building is downgraded to class B.
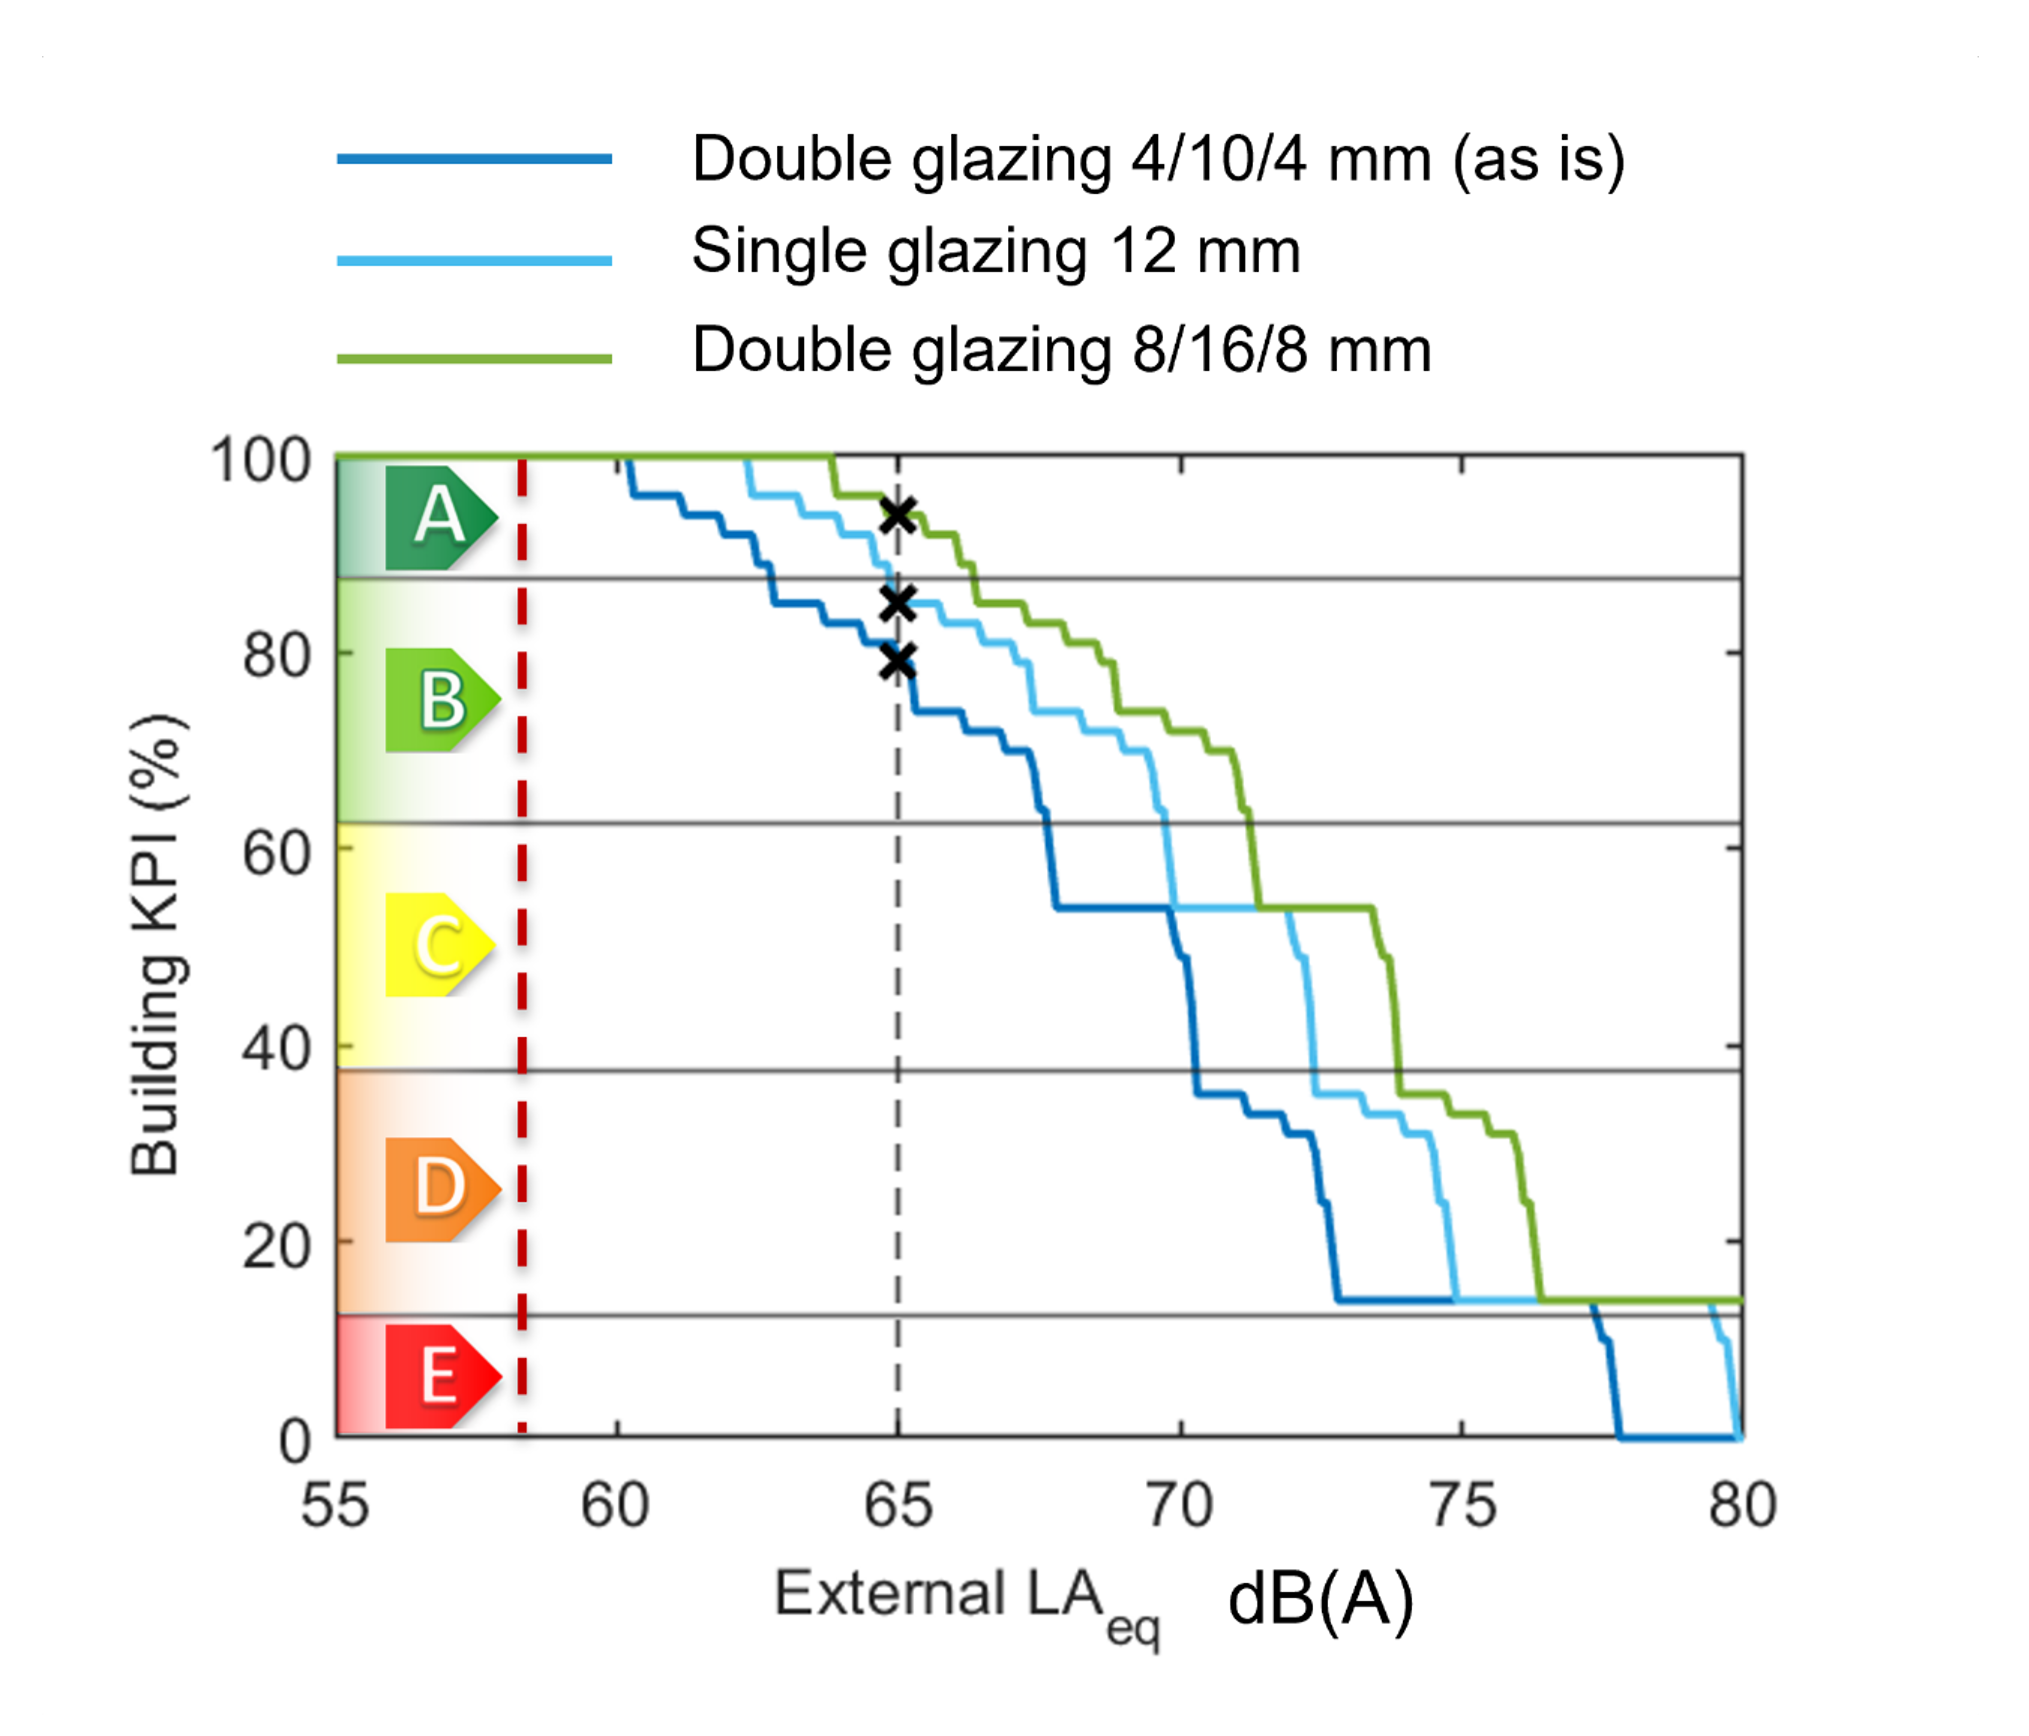
Figure 24 Acoustic comfort KPI trend for external noise level ranging from 55 to 80 dB(A).
The red and gray dashed vertical lines at 58 and 65 dB(A) respectively represent the level of the external noise given by the strategic noise map and the one measured during a sporadic noise event (children playing basketball)
A simulation of two renovation scenarios has been performed considering the replacement of the building glazing systems. The as is condition is double glazing 4/10/4 mm and is represented in Figure 24 by the blue line. The two renovation options are:
While the first scenario bring an improvement of the KPI (from 80 % to 88 %), the second one (double glazing 8/16/8 mm) allows the building to upgrade definitively to class A.