- Anwendungsfälle
- Co-Creation Space
Community
Organisationen
Kooperationspartner

- Anmelden
This document aims at describing 'Site Analysis and Planning' use case which is implemented as part of BIM-SPEED EU Horizon2020 project .
The aim of the BIM_SPEED project is to:
The 'GIS data provider service' implemented as part of BIM-SPEED project is developed with the need for the objectives set by the BIM-SPEED Project. It helps in:
The data provided with the GIS data provider service provide information and insights regarding:
In renovation projects, it is essential to collect information about the surrounding of the construction site to plan in advance how to access the site and how to proceed the next stages of the project. The site analysis and planning use case defines the limitations and opportunities in the construction site which helps for an appropriate development outcome if known prior to the designing phase of the project. Site analysis and planning in building renovation refers to all the analysis and decisions made before the building data collection phase. This analysis can be performed via collecting surrounding geospatial and environmental data in specific radius around the building under renovation. These geospatial datasets can be visualized in a GIS software, and after creating relevant maps, the construction site can be evaluated by the project team. The mentioned geospatial data can be retrieved from open access Web Feature Services (WFS) and downloaded in Shapefile format which represent vector data in 2D dimension. They also can include 3D surrounding buildings in CityGML format if available. This use case provides information for further use cases in next stages of building renovation as well.


Fig 1: Geospatial data collection; common practice vs BIM-Speed approach
The benefits of BIM-SPEED approach:

Focusing on the tool in detail, it helps in:
The ontology behind the service which lists the concepts required for each use case is presented in this article:
https://linkedbuildingdata.net/ldac2020/files/papers/05paper.pdf
IFC: International Foundation Class
GIS: Geographic Information System
WFS: Web Feature Service
GPS: Global Positioning System
The overall process for site analysis and planning is presented in figure below. the procedure starts with collecting the data from the 'GIS data provider service' by extracting the exact location of the building from the IFC file, generating maps from those datasets and interpreting and decision-making based on the information provided by the datasets. The overall process is further explained through its implementation on a demonstration site.
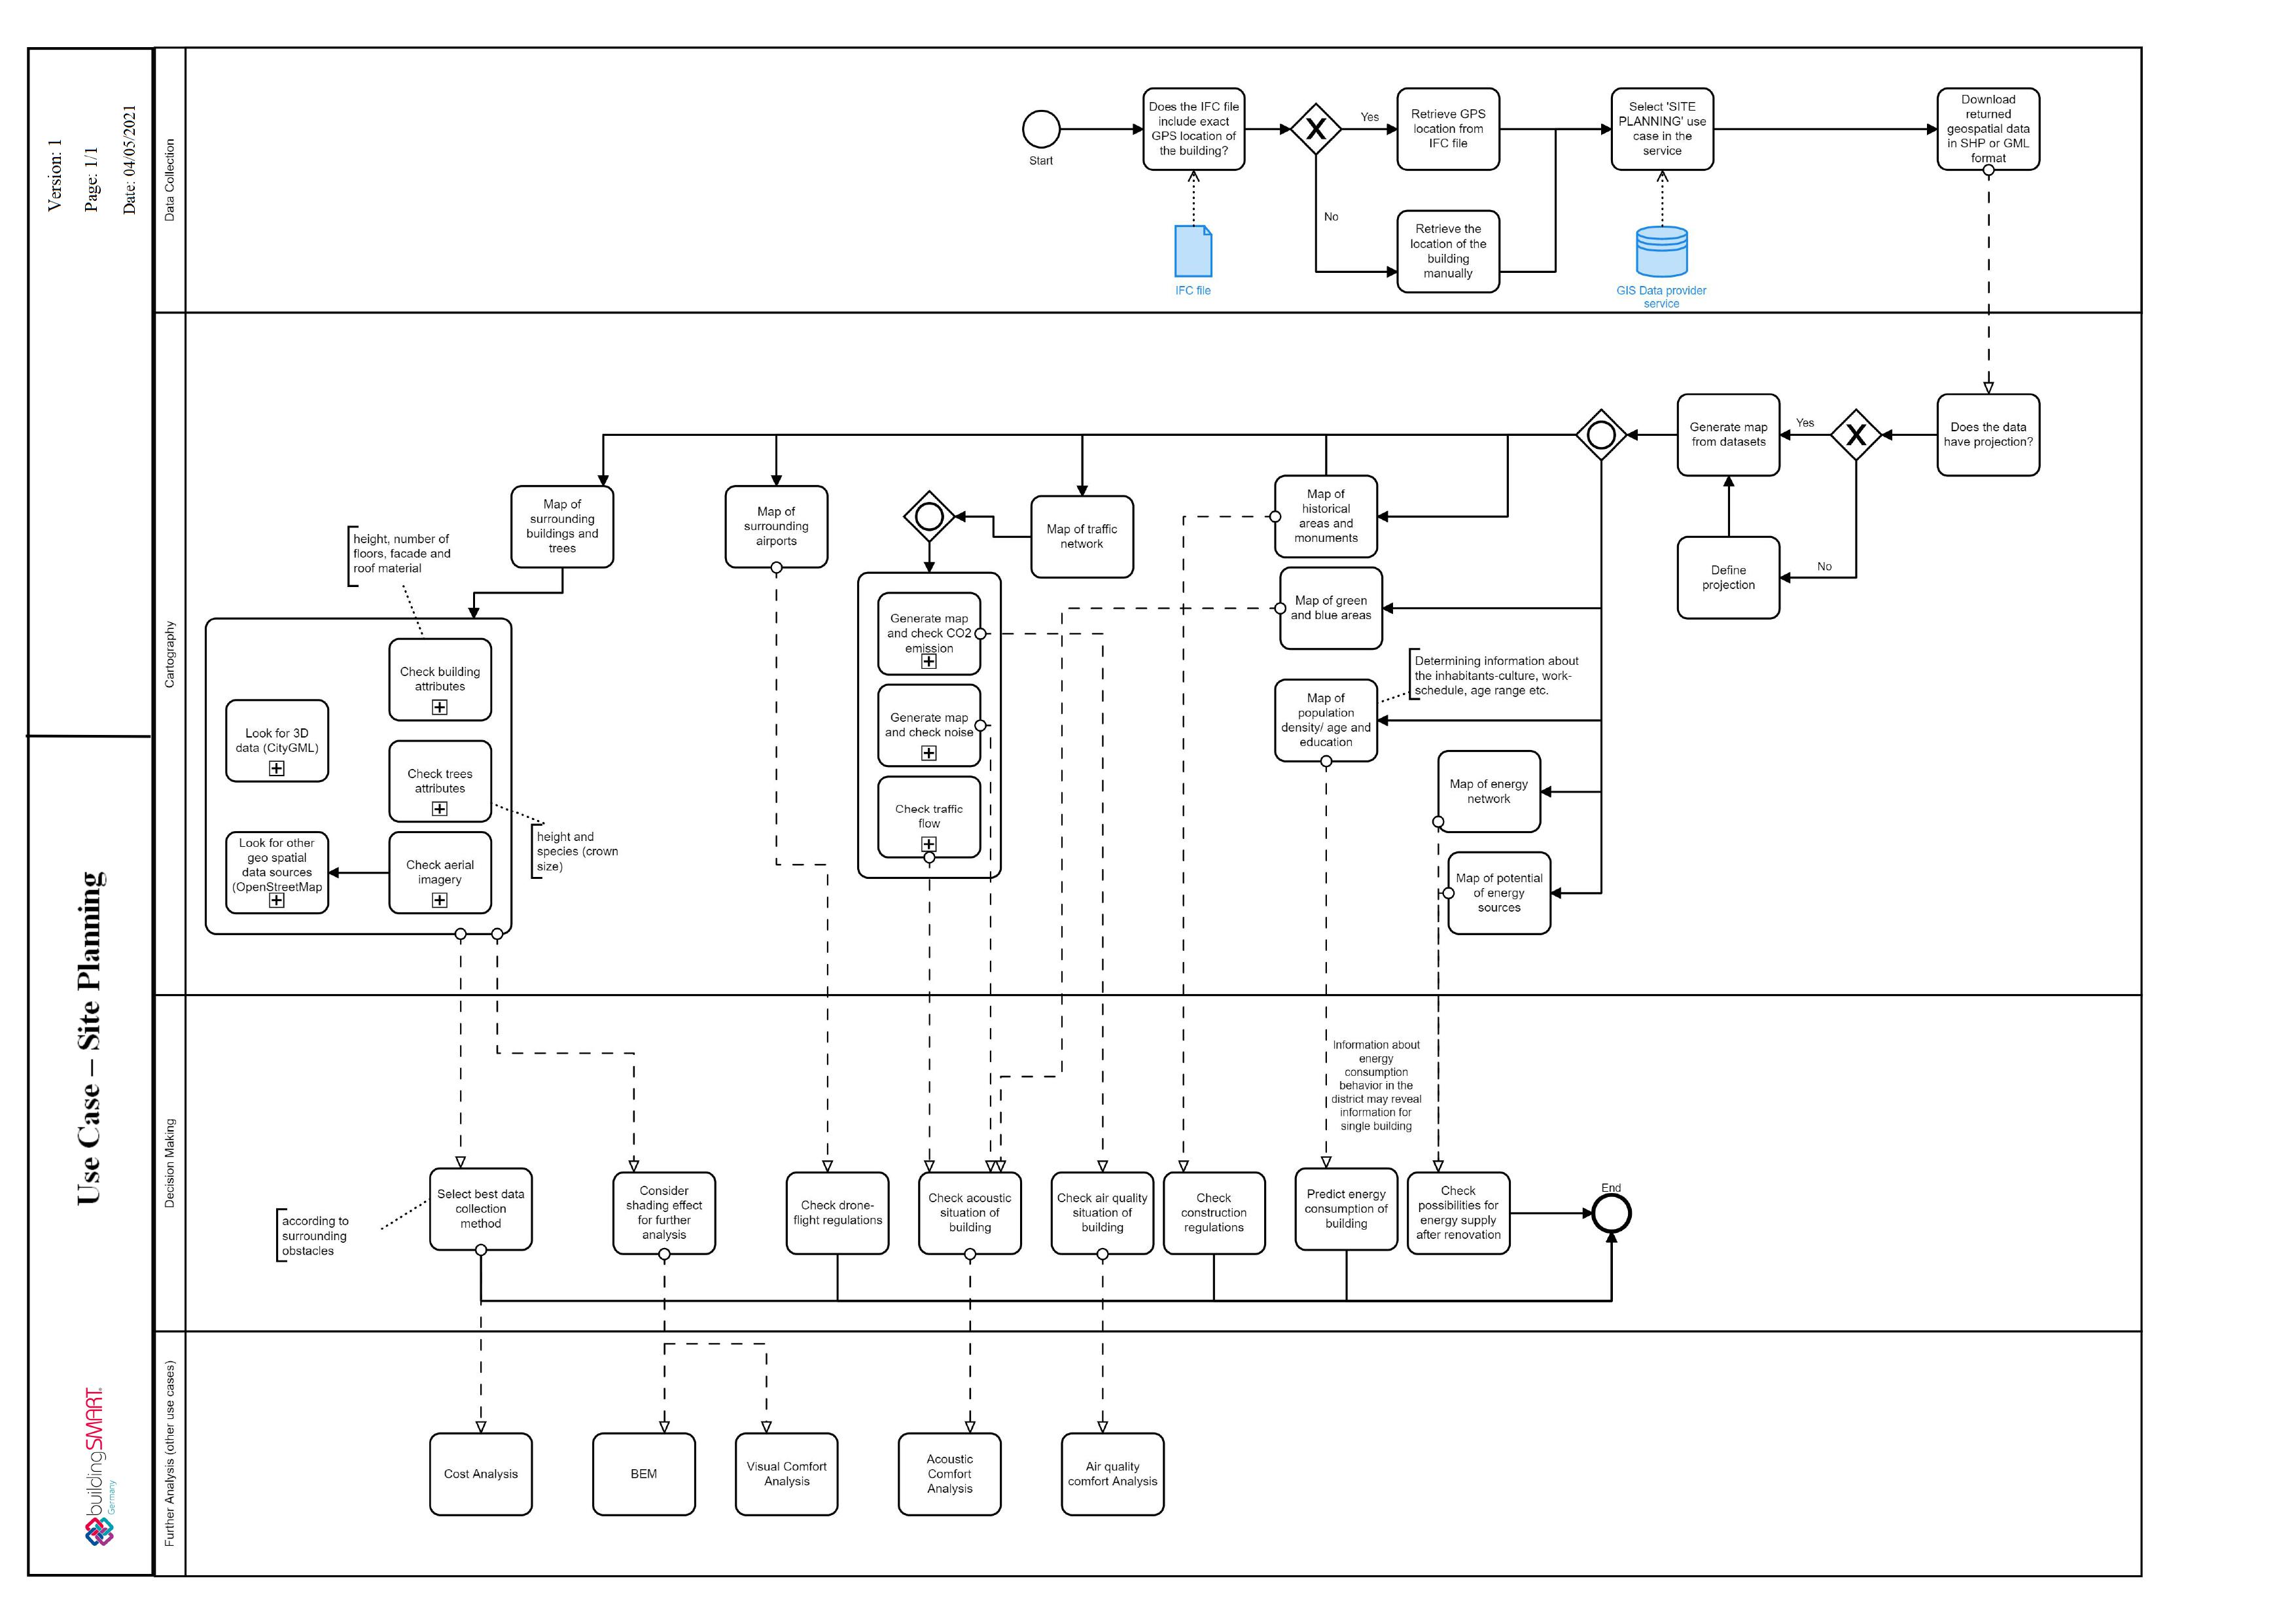
Fig 2: Site planning process map
In order to make the workflow clear, a summary of the demonstration of the use case on one of the BIM-SPEED demonstration sites is provided below. The full description is also provided attached to this document.
The IFC file of the building includes information about the GPS location of the building. The user can access the GIS data provider service from an IFC file in the BIM-SPEED platform. After opening the service, the procedure starts by checking the IFC file to find out the GPS location of the building. If the IFC file contains the GPS location of the building, it will be used for data extraction, otherwise, a map will show up, on which the user can select the location of the building. In addition, the user can select the AOI (Areas of Interest) radius for which the data collection is desired.
Next step will show a list of pre-defined use cases from which the user should select one. From the list of suggested datasets, it is possible to download one or more on the BIM-SPEED platform or on a local machine. After selection, the datasets can be downloaded in the BIM-SPEED platform.
These datasets need to be visualized in a GIS software. Different software solutions allow the visualization and analysis of geospatial data. ArcGIS Version 10, ArcGIS Pro and ArcGIS Online have been selected for this purpose in this deliverable.
To have a realistic view, it is very important to consider the location of the land and position of the building site. It is important to see the building in relation to sun, wind, water, electricity and other utilities, neighbors and preserving privacy, accessibility to the site via walkway and road, existing features such as surrounding buildings and trees and constraints such as construction site restrictions, and so on.
The reference building is surrounded by other buildings that can cause shading effects. To investigate the shading effect of the surrounding buildings, information about the height or number of floors of the surrounding buildings is required. Although, to have a better demonstration of the shading effect, 3D visualization is a more intuitive approach. This shading effect can cause a cooling and heating effect and can influence the visual and thermal comfort of the building. So, in the building energy modelling and visual comfort analysis of the building, it is important to consider this effect along with the physical structure of the building and weather conditions. Along with this, the tree layers surrounding the building are also to be taken into consideration.
In order to make sure all features in the surrounding are considered, beside this service, other sources of information such as aerial imagery has also been used. Details on the implementation of this tool on a demonstration case is covered in the next section.
DEMONSTRATION SITE - LICHTENRADE BERLIN
The demonstration site is located in Lichtenrade, Berlin, Germany. It is a seven storey apartment block with 56 dwellings which was built in 1960 in Berlin, Germany. This building is part of a 2,5 hectare urban redevelopment prefabricated building is awaiting major renovation at a later stage, with temporary measures and possibly adding 2-3 storeys in the planning. BIM model of the building have been developed and available in the BIM_SPEED platform. During the BIM-SPEED project new tools and solutions supporting as-built data acquisition, designing, energy simulation and construction works will be implemented. As part of as-built data collection, surrounding geospatial data is collected using the GIS data provide service.
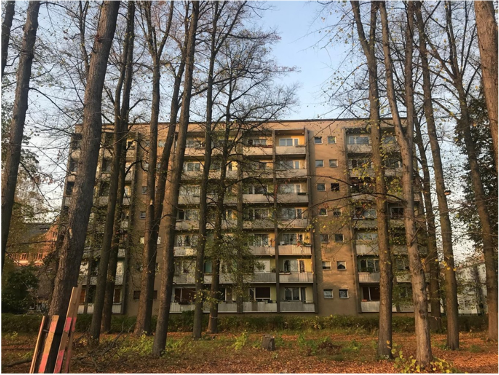
Fig3: Berlin Lichtenrade demonstration case
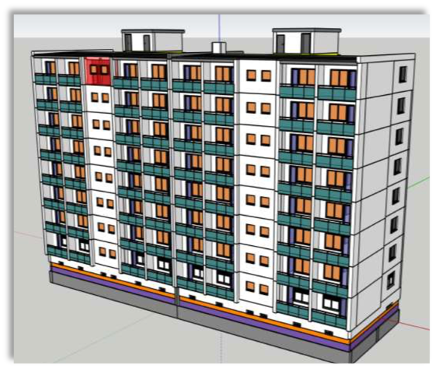
Fig4: BIM of Berlin Lichtenrade demonstration case
A radius of 200 meters is selected for retrieving the data. After retrieving the data, if there is lack of data in some area, it is also possible to use data from other data sources such as OSM (OpenStreetMap). For the current investigation, in addition to the data provided from BIM-SPEED GIS data provider service, single trees from OSM
data have been added. Moreover, aerial imagery and satellite imagery has been used to check the data in the
surrounding. Besides these 2D vector datasets, it is also possible to collect 3D GIS data for Berlin. The data has been downloaded for a specific bounding box around the reference building in CityGML file format. Via ArcGIS Pro, it is it possible to visualize the data along with the BIM data in the IFC file format.
ArcMap version 10.6 has been used to visualize these vector datasets which can be downloaded either in GML or Shapefile format via the service, or via accessing the OSM *.pbf file. Figure below shows the single trees and street-line trees. As shown in the aerial imagery, in the backyard of the building, lines of trees can be seen which are not provided in the single tree layer. The reason is that the tree layer includes the data in the public area, while these trees are located in the private area. One way to include such data is by using the satellite imagery and extracting the vegetated area according to the infrared band of the image by calculating the NDVI (Normalized Difference Vegetation Index). An NDVI layer from Sentinel II imagery is available from ArcGIS Online data sources (as shown in Figure).
In case, in some areas, there is overlap between the data features, spatial analysis and selection by location helps to select only those desired features, so that the result does not include redundant features in one location.
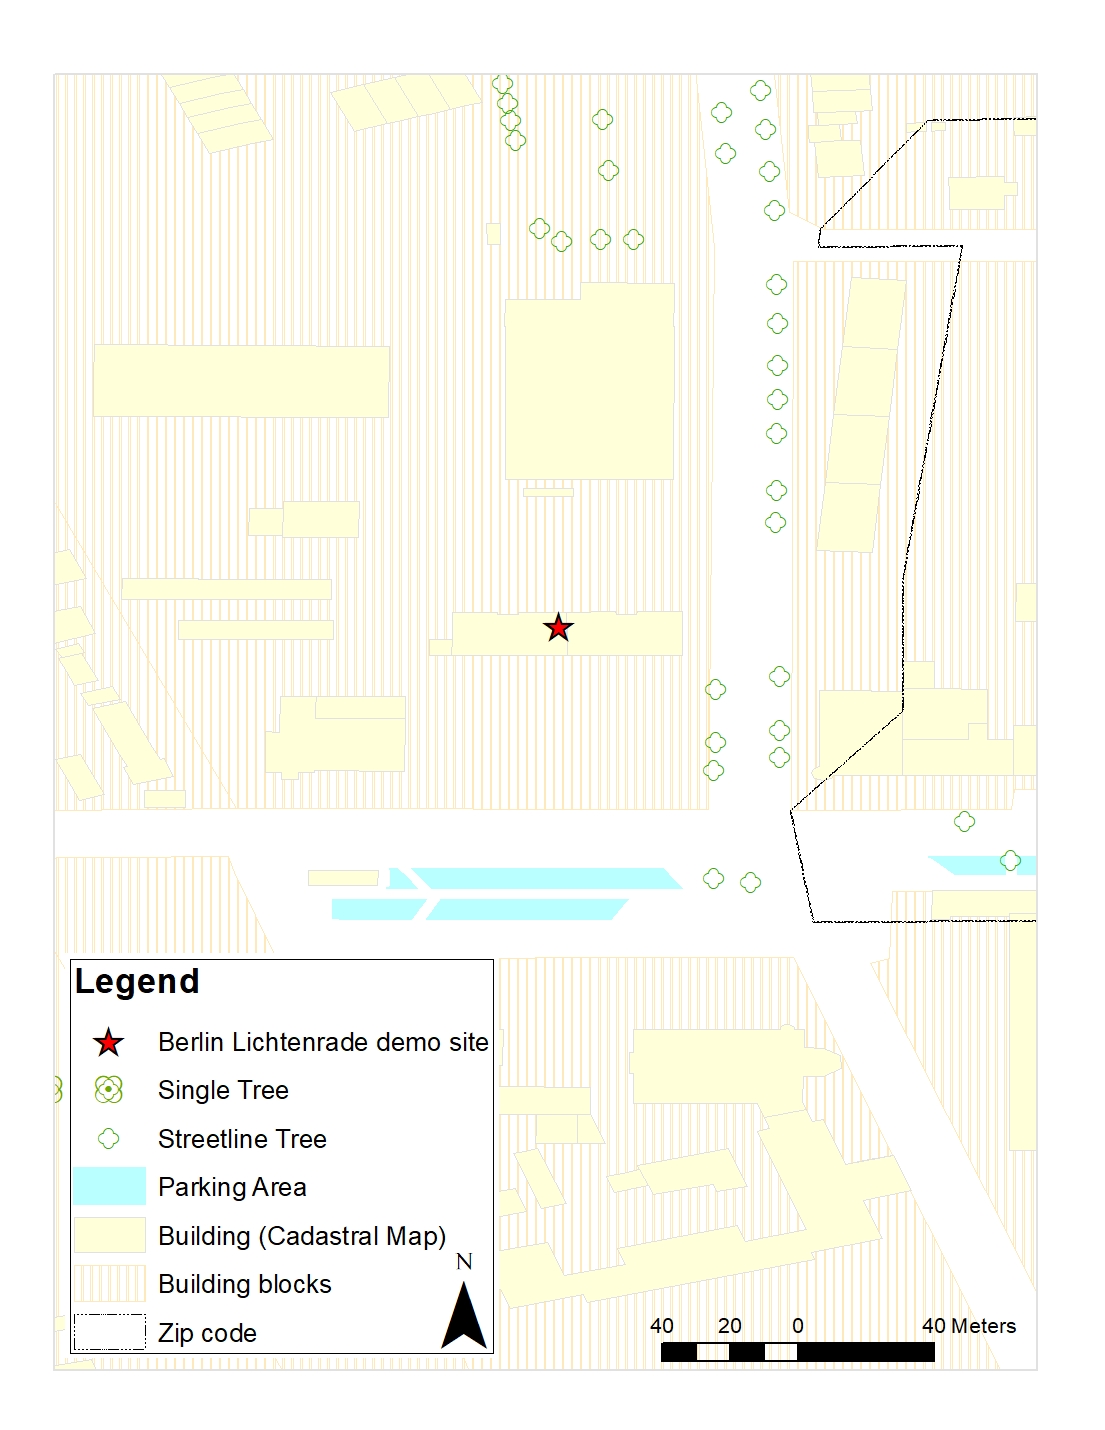
Fig5: Surrounding features: buildings, trees and parking areas
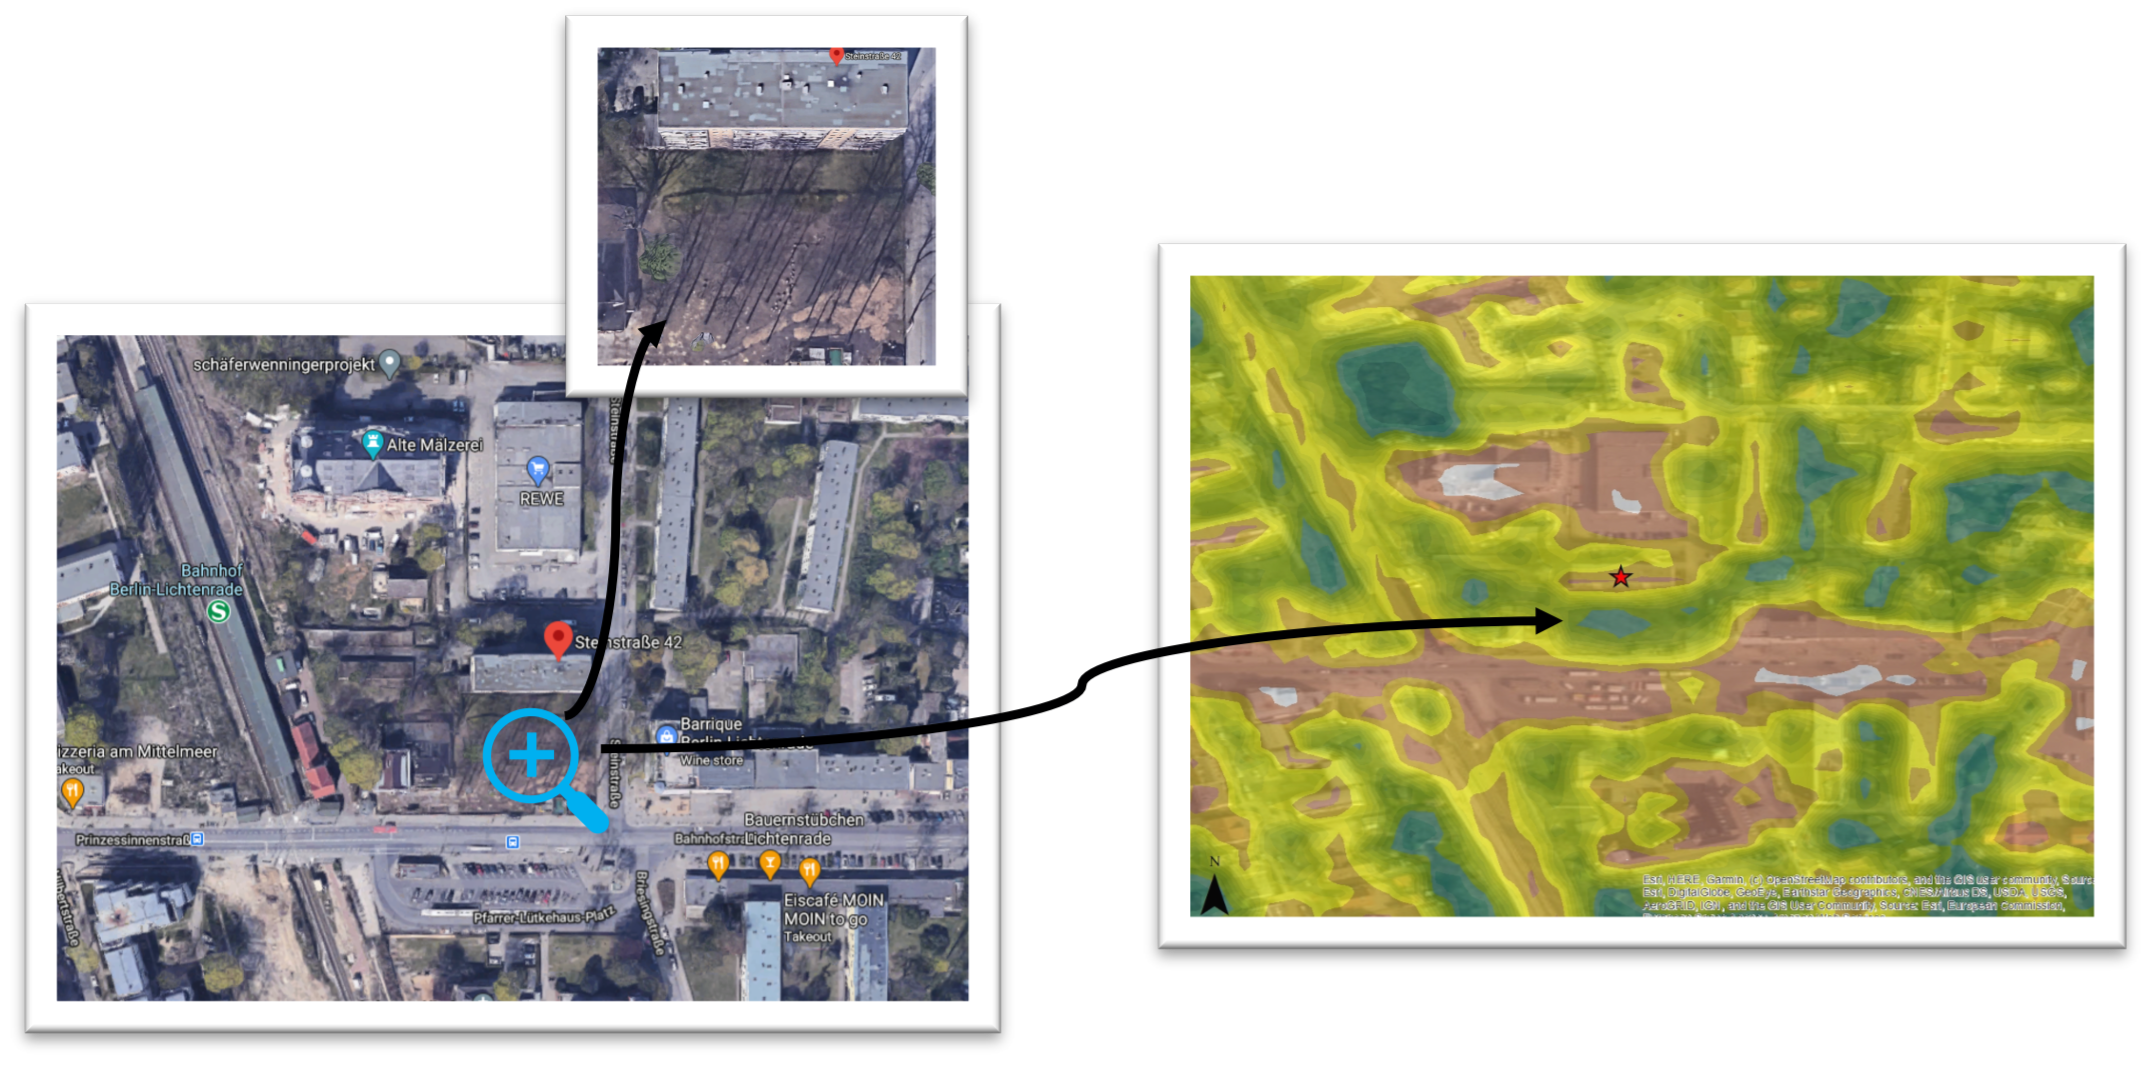
Fig6: Arial imagery of the Berlin demonstration case Fig7: NDVI of the Berlin demonstrate urban context
The 3D data of the Berlin-Lichtenrade demonstration site is provided from the Business Location Centre geoportal(https://www.businesslocationcenter.de/berlin3d-downloadportal/?lang=en#/export) in CityGML data format. It is possible to view the CityGML file in a scene in ArcGIS Pro along with the IFC file of the site.
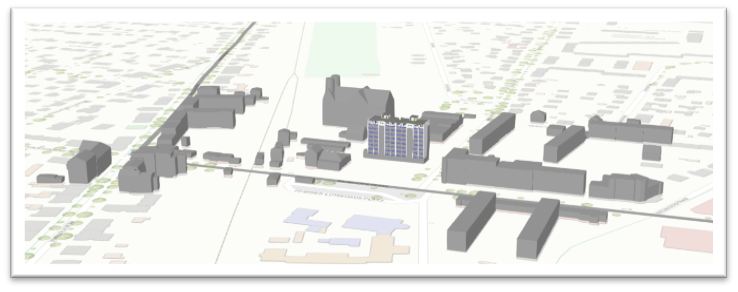
Fig8: 3D surrounding buildings of Berlin demonstration case
The tree layer reveals that there are solitary trees in the public area, which can affect shading on the building, or can cause disturbance in data collection. In addition, as shown in the aerial imagery, there are trees in the backyard of the building as well. Particularly as the trees are located closely to the façade of the building, 3D and thermal data collection via drone-flight will probably raise problems. Knowing in advance about the surrounding of the building, constant obstacles such as built area and solitary trees, as well as possible temporary obstacles such as parking areas help planners and data collectors to know in advance which data collection approach best fits the area. If drone-based approach needs to be utilized for a demonstration site, it is important to consider the location of airports in the vicinity of the building.
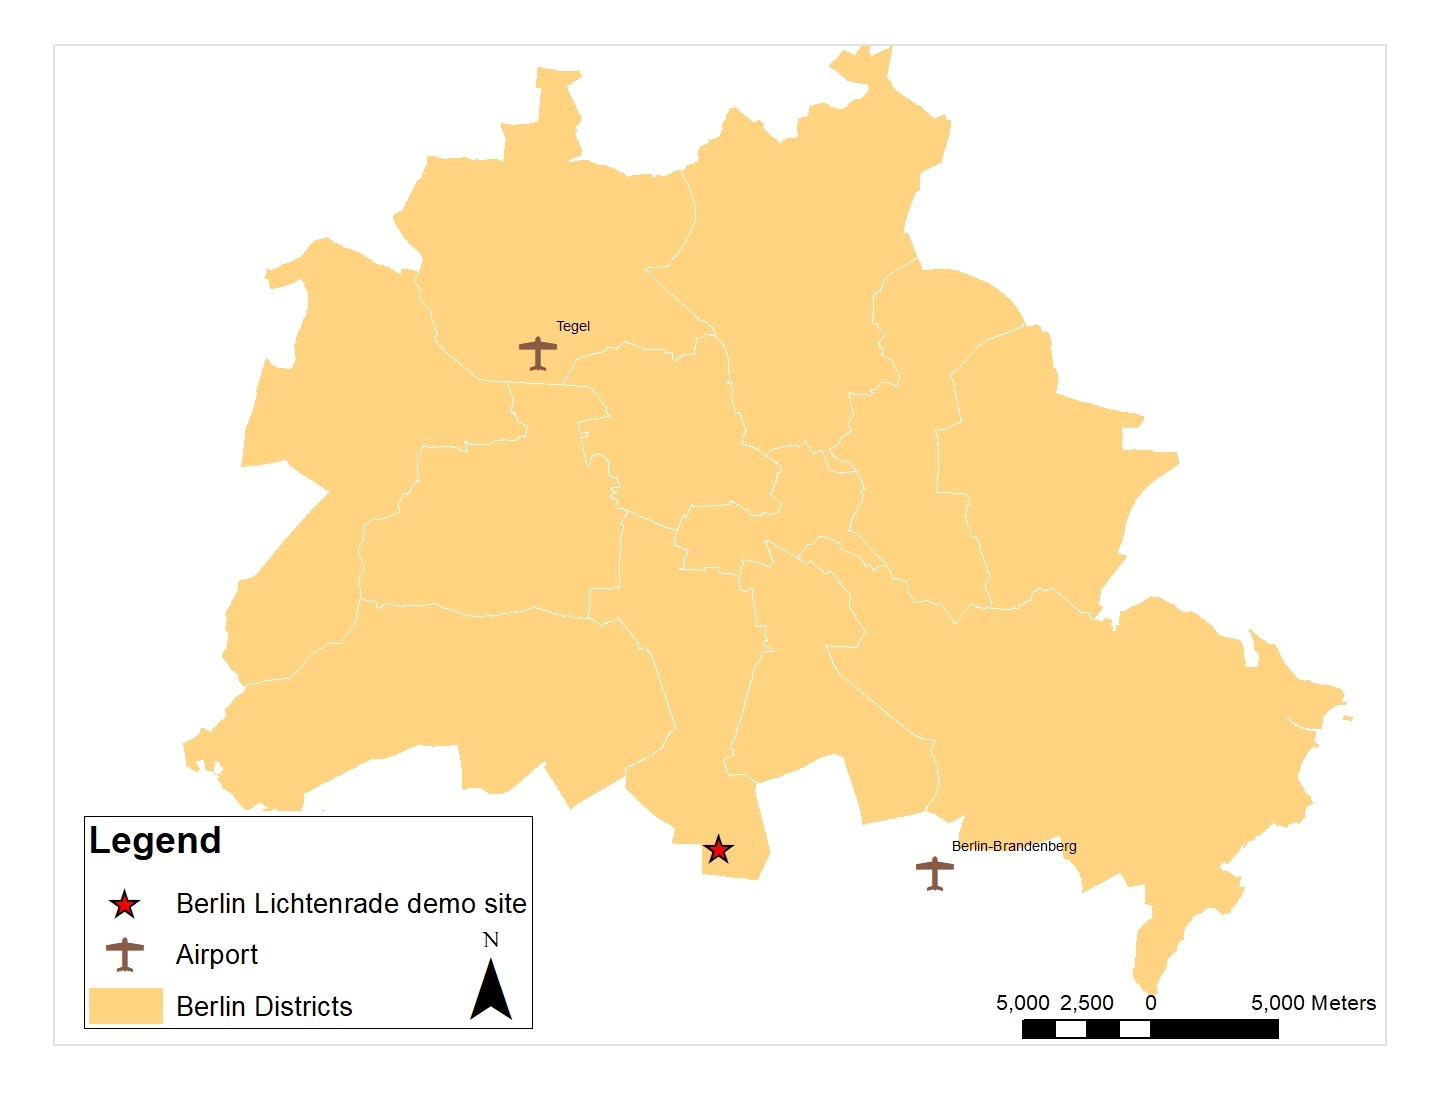
Fig9: Airport placements in Berlin city
For the case of this pilot, the vicinity to the airport required the data collection team to ask for a confirmation from the airport for the drone-flight, which has been done in advance. But one problem was not investigating the surrounding in advance which caused issues in the 3D and thermal laser scanning. The trees in the backyard close to the façade of the building made it difficult for drone-flight. This resulted in changing the method for data collection for 3D laser scanning to terrestrial methods which gained more time for the data collection phase. In addition, as the thermal scanning was done by a drone, only the roof thermal scanning has been performed which caused a limitation in the data acquired. Knowing in advance this situation, could help gain time, save money and plan better the presence of the data collection team in the site.
The building is located within a historical or monumental area. In order to have more information about the monuments in the area, a link has been provided in the attribute table of the layers. By clicking on the hyperlink, it is possible to open the related information. Based on the information of the historical areas, it is possible to check possible construction regulations.
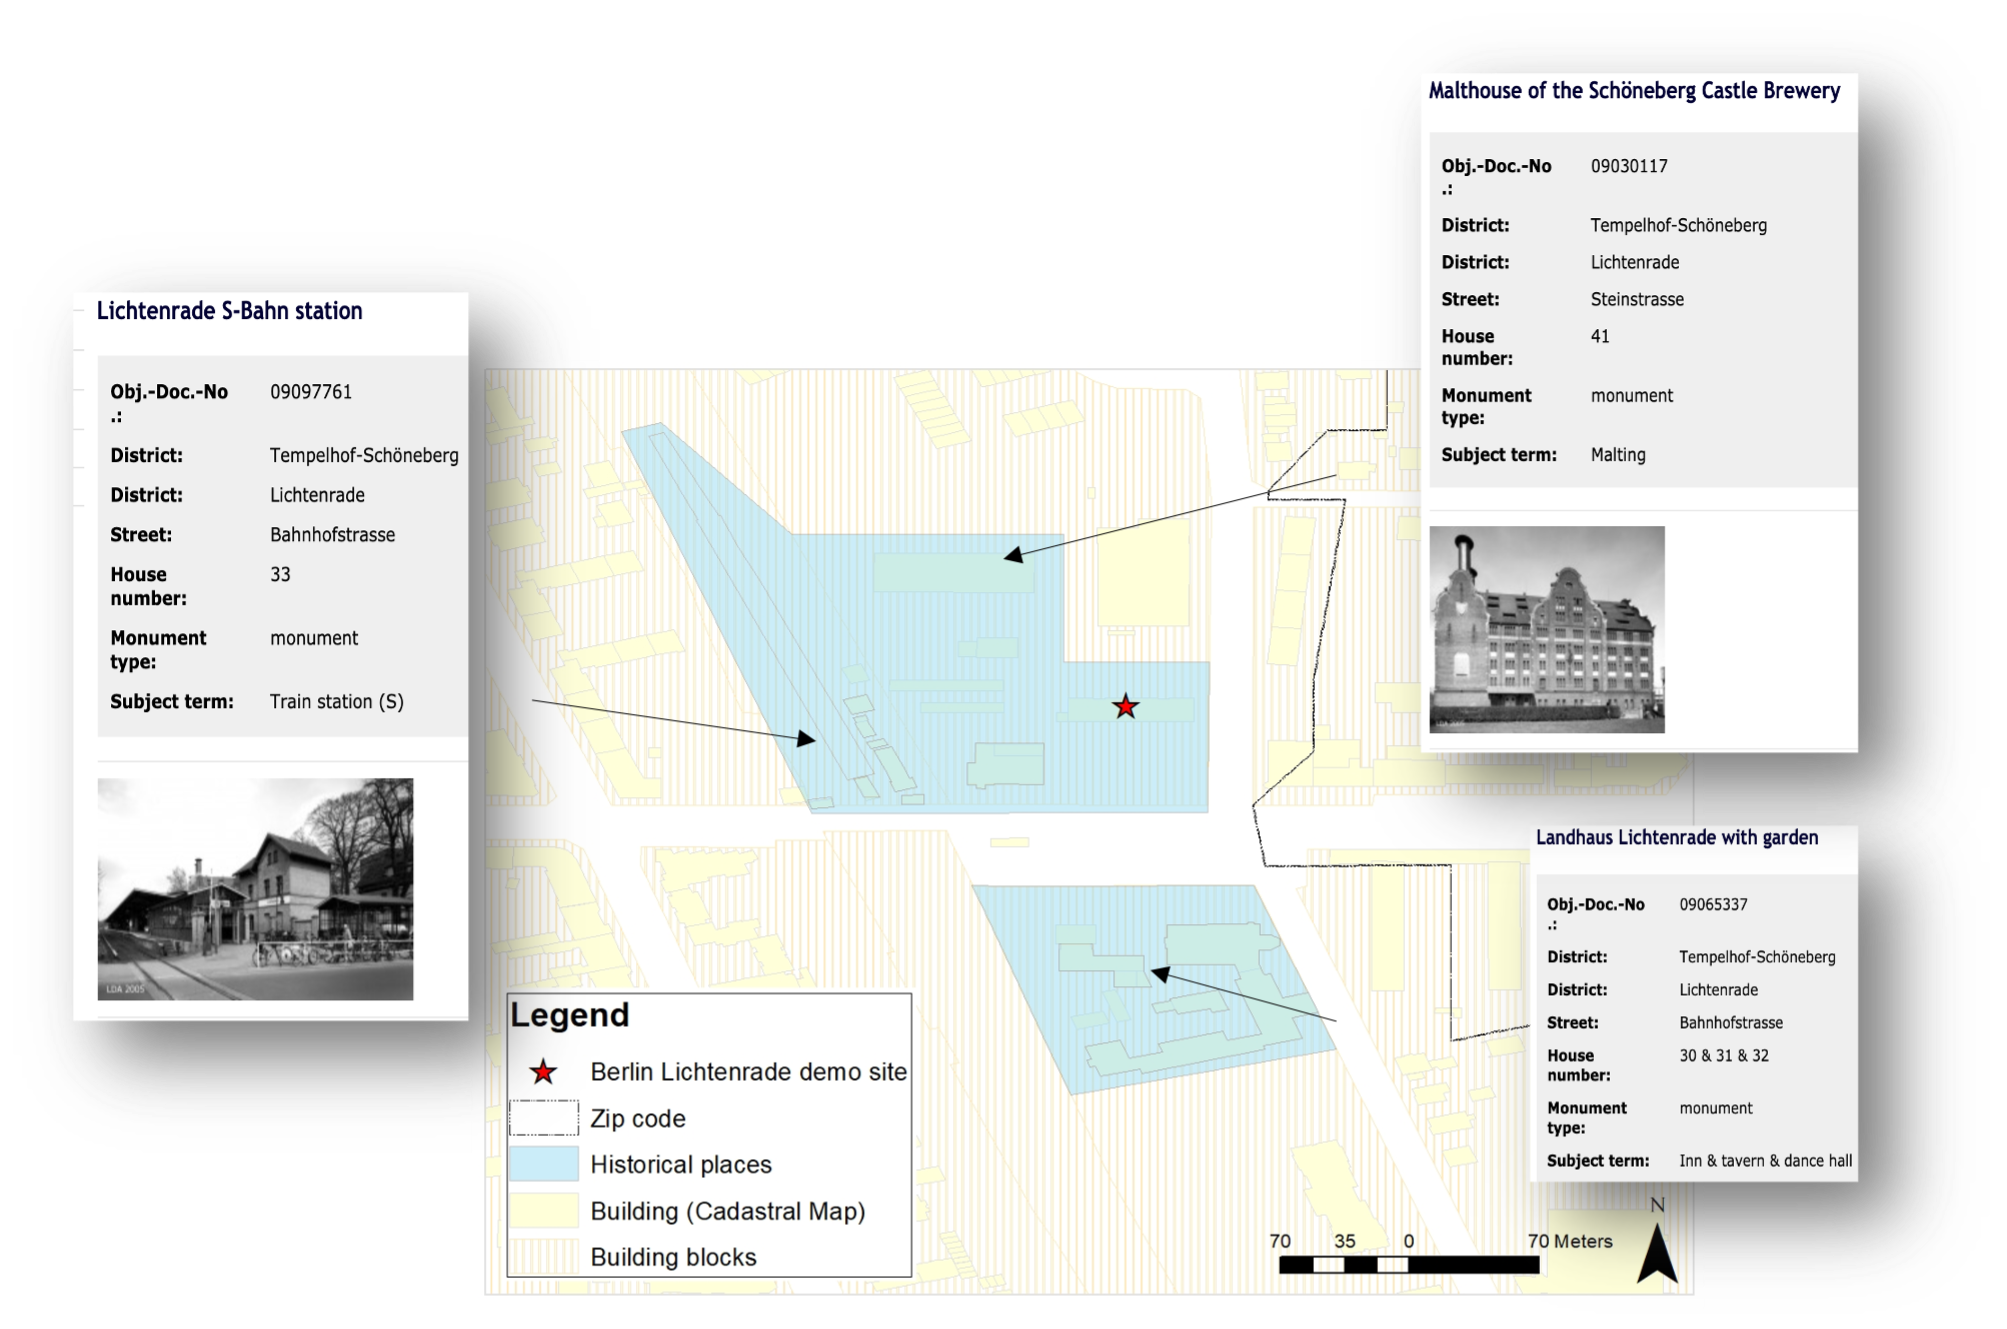
Fig10: Historical areas in the surrounding of Berlin demonstration case
The building is located close to the main roads, meaning that access to the building for the construction process is not problematic. On the other hand, the roads and the railway located at a very short distance to the building cause noise pollution as well as air pollution. This points out the fact that acoustic and air quality comfort analysis of the building should be included in the plan of the performance analysis. Also, for those purposes, it is possible to use noise data and CO2 emission data that are already available from GIS sources. Vegetated areas, parks, lakes, ponds, or rivers and in general green and blue spaces in the district can have an impact in two ways. On the one hand, they change the microclimate in the area by causing a cooling effect, that can affect the thermal comfort of the building. That can be predicted via building energy modelling and comfort simulations. On the other hand, because these areas can be considered as public spaces where people gather, or where children’s playgrounds are located, they can affect the acoustic situation of the area. As shown in figure below, such objects are not located in close distance to the building in this pilot.

Fig11:Roads and railways in the surrounding of Berlin demonstration case
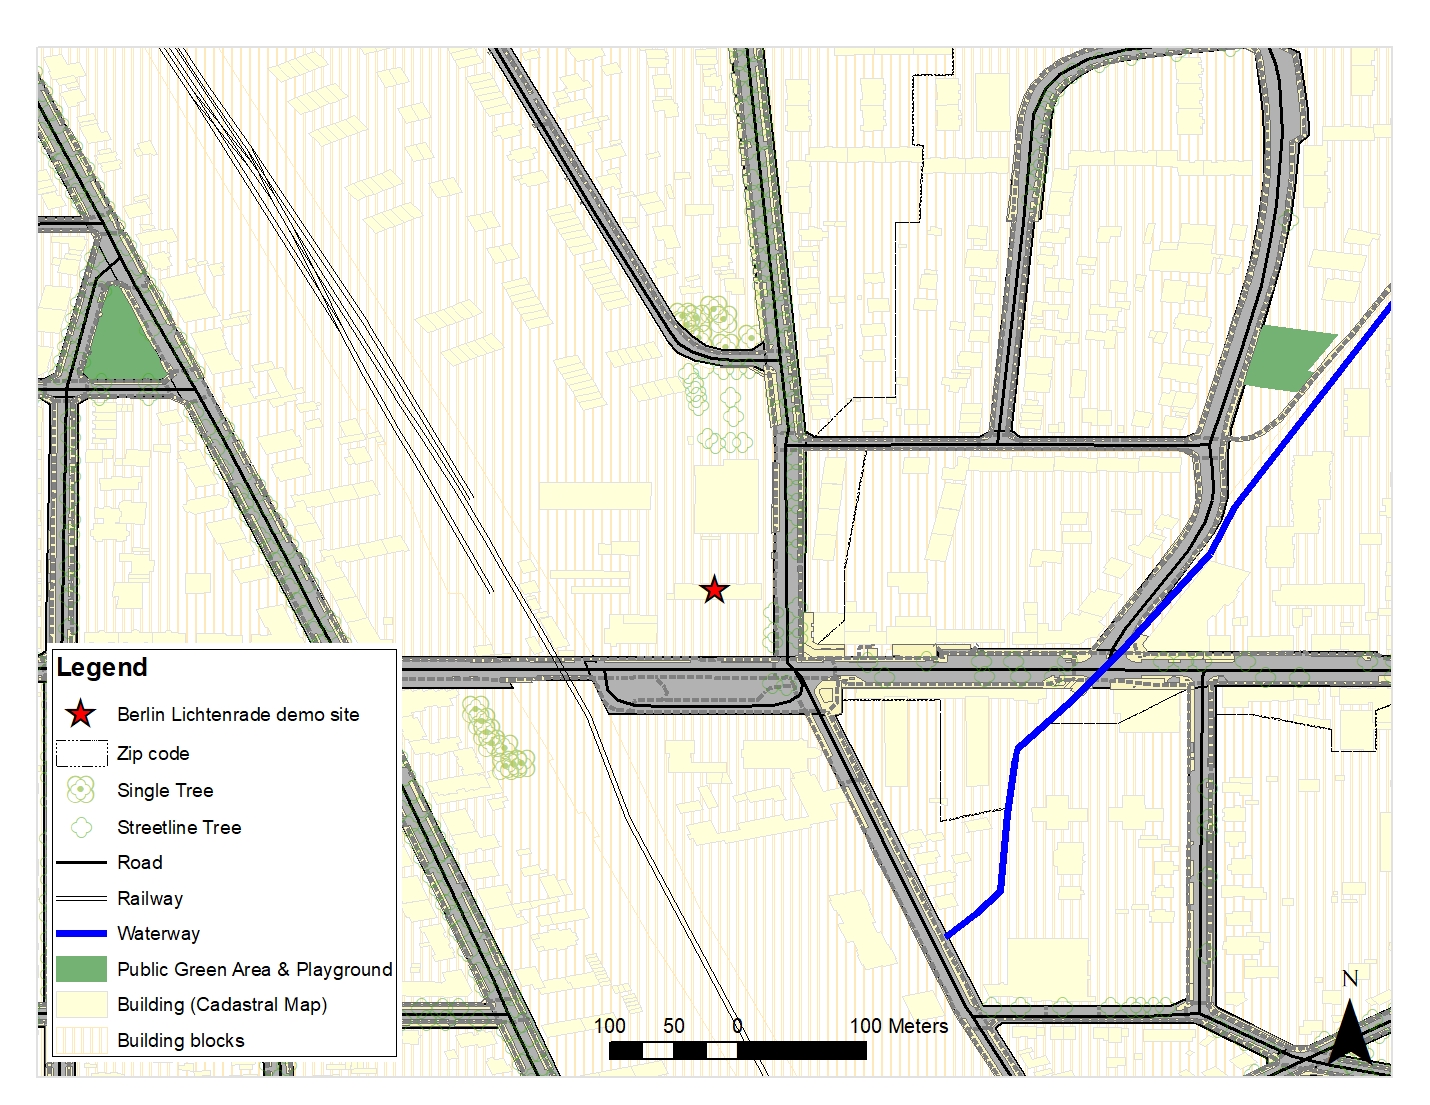
Fig12: Public green and blue areas in the surrounding of Berlin demonstration case
Therefore, according to the surrounding features, an acoustic, air quality comfort analysis is required to be planned for this demonstration site.
The building is located in an area where between 71-150 people are living per ha. In comparison to other building blocks in the surrounding of the building, population density is less. On the other hand, urban density or Floor Space Ratio (GFZ) describes the ratio between the gross floor space of all floors of every building and the size of the area. The building is located in a denser urban area in comparison to other building blocks in the surrounding. This can give some impression about possible energy consumption in the area.
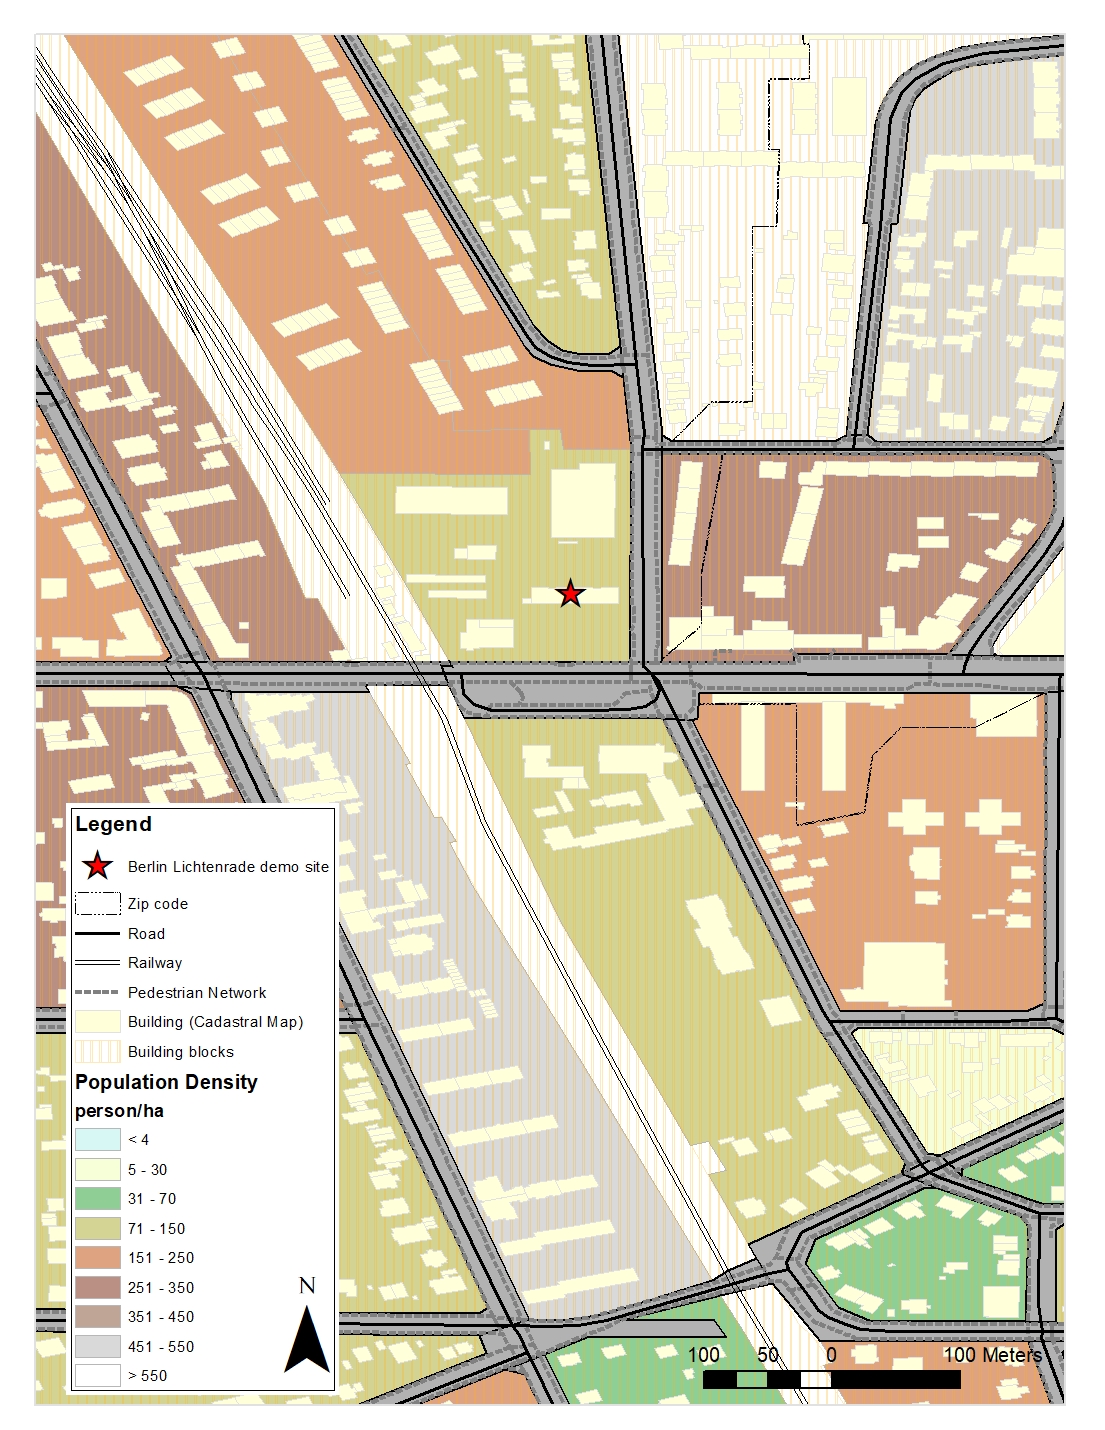
Fig13: Population density of the urban context of Berlin demonstration case
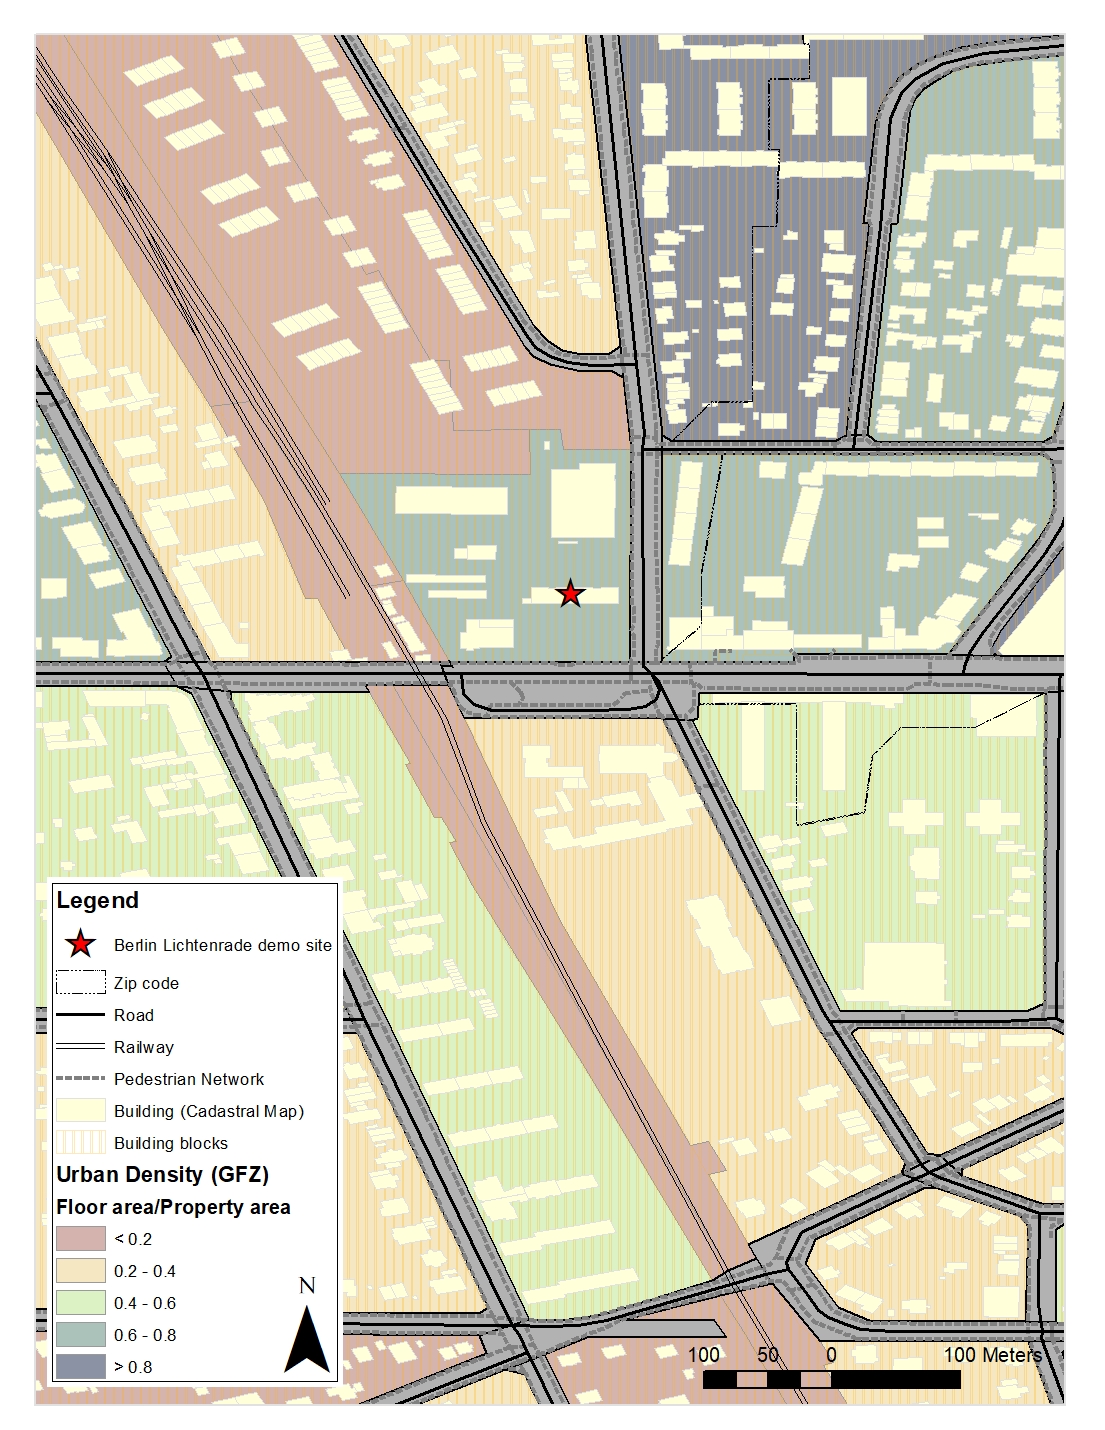
Fig14:Urban density of the urban context of Berlin demonstration case
More information about the people living in the vicinity can reveal information about the people living in the reference building. A region is usually homogeneous regarding its cultural characteristic. Thus, if such data is available for the district and region, it can give some impression about the consumption behavior of people living in the building under renovation. Population age, education, and cultural background can reveal some information that can help in this respect.
All in all, the site analysis for this demonstration site reveals information for decision making about 3D and thermal data collection which leads to control cost and quality of the data. In addition, it suggests that an acoustic and air quality analysis needs to be considered in the planning of the renovation workflow. And in the process of Building Energy Modeling (BEM) surrounding obstacle and visual comfort analysis, surrounding obstacles and their characteristics such as height, façade material, roof material and so on are required to be investigated. Moreover, the building is located in a dense urban area, a high energy consumption should be expected for this building as well. Overall, implementation of this tool has provided a platform for an enhanced site analysis which enables planning and further analysis for the detailed design phase.
Following the information provided from the surrounding data, it can be clear how these datasets can be applied for other use cases as shown in figure below.
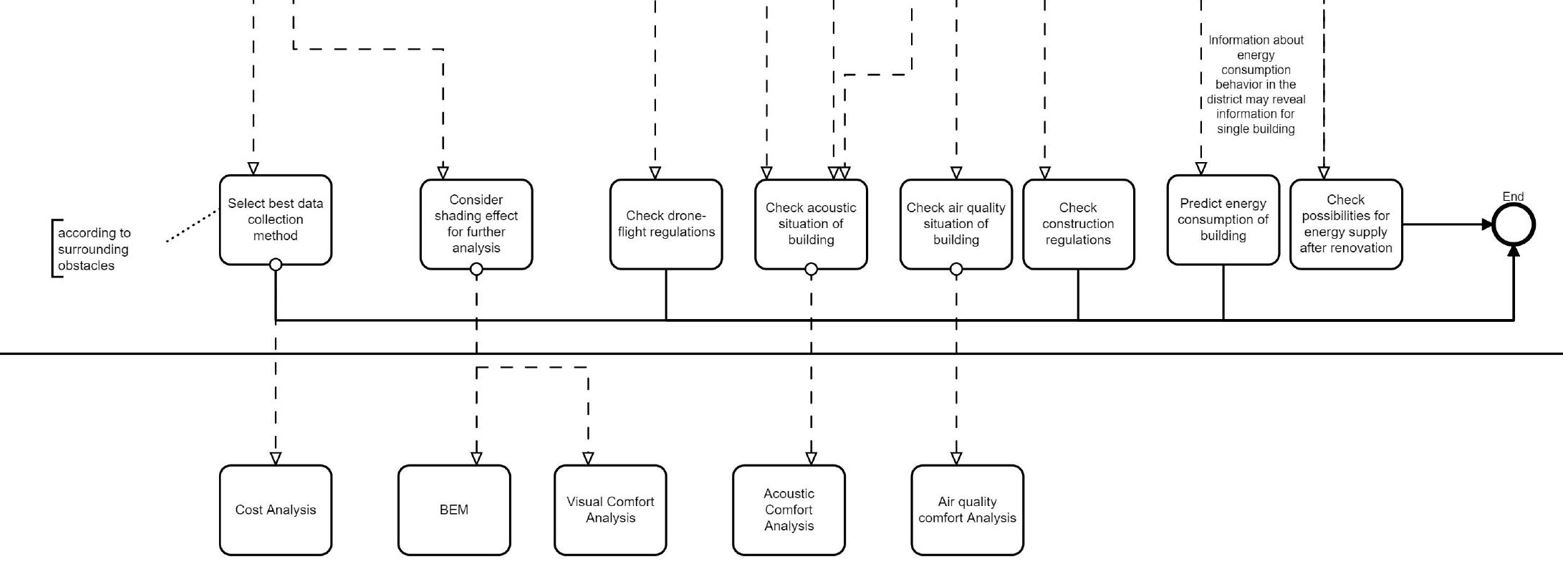
Fig21: Connection to other use cases in process map
When connecting to surrounding data, it is important to consider the exact location of the building. This can be reflected in a BIM model. For instance, the IFC file can include this information in the ifcSite component. On the other hand, surrounding geospatial data can be represented in different file formats. While 2D geospatial data can be represented in Shapefile, GeoJSON and GML format, the 3D geospatial data can be represented in CityGML format which is an XML-based format to describe 3D city objects. Depending on the available software, supporting one or some of these formats may be possible.
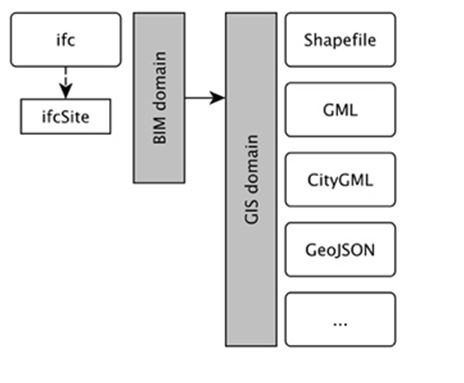
Fig22: Data format exchange in GIS data provider service
All documents are licensed as "Creative Commons Attribution-NonCommercial-ShareAlike 4.0 International License" as Attribution - non-commercial distribution - under the same conditions
For further information see: creativecommons
These documents do not claim to be complete. Nor are they to be understood in the sense of a recommendation or guideline that is generally valid from a legal point of view, but are intended to support the client and contractor in applying the BIM method. The use cases must be adapted to the specific project requirements. The examples given here do not claim to be complete. Information is based on practical experience and should therefore be regarded as best practice and not generally applicable. As we are in a phase in which definitions are only just emerging, the publisher cannot guarantee the accuracy of individual contents.
NOCH NICHT REGISTRIERT?
Registrieren Sie sich für den Use Case Management Service kostenlos, um Ihren ersten Use Case zu erstellen.
Registrierte Benutzer können den Download-Bereich und die Kommentarfunktionen nutzen.

The GIS data provider service is integrated into BIM-SPEED platform and accessible from there.
The first step to implementing this tool in this procedure is selection of the exact location of the building under renovation on the Earth. This can be extracted from the ifcSite component of the IFC file. It is also required to know in which radius around the building the collection is required to be done. This step is also reflected on the process map as shown in figure below.
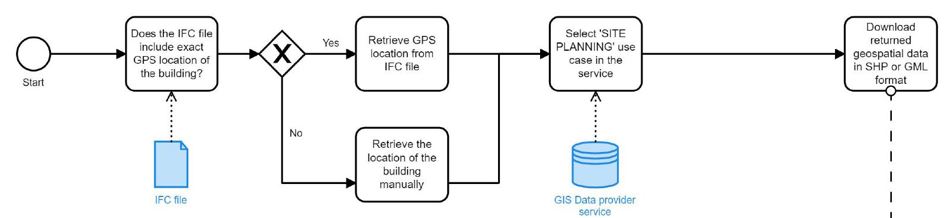
Fig15:GPS location extraction in process map
The images below provide details into accessing the tool from the BIM Speed platform, including selection of the exact location of the building, selecting the radius around it and selection of the use case for which surrounding data in required or useful.
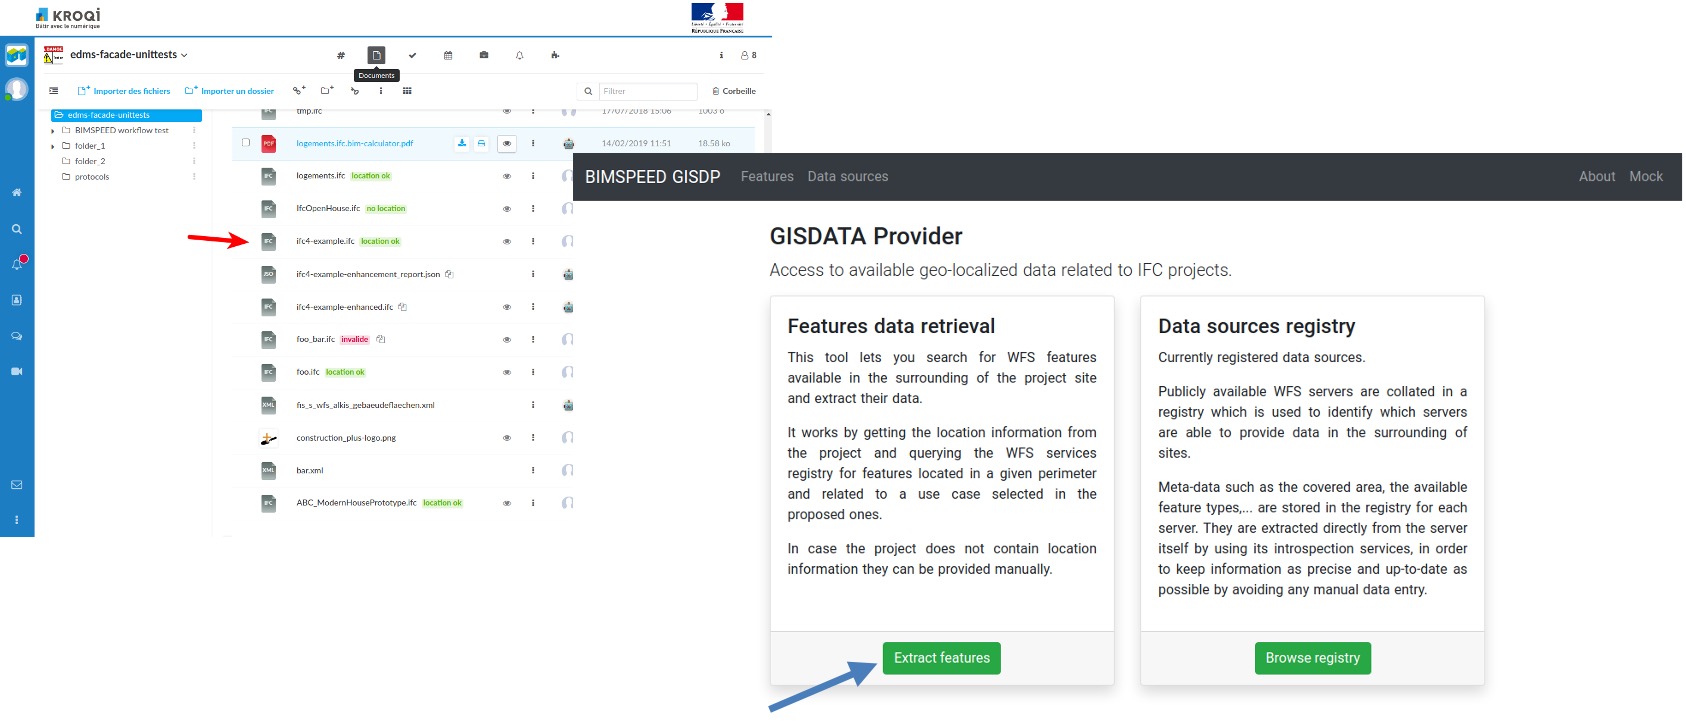
Fig16:Opening GIS data provider service from BIM-Speed platform
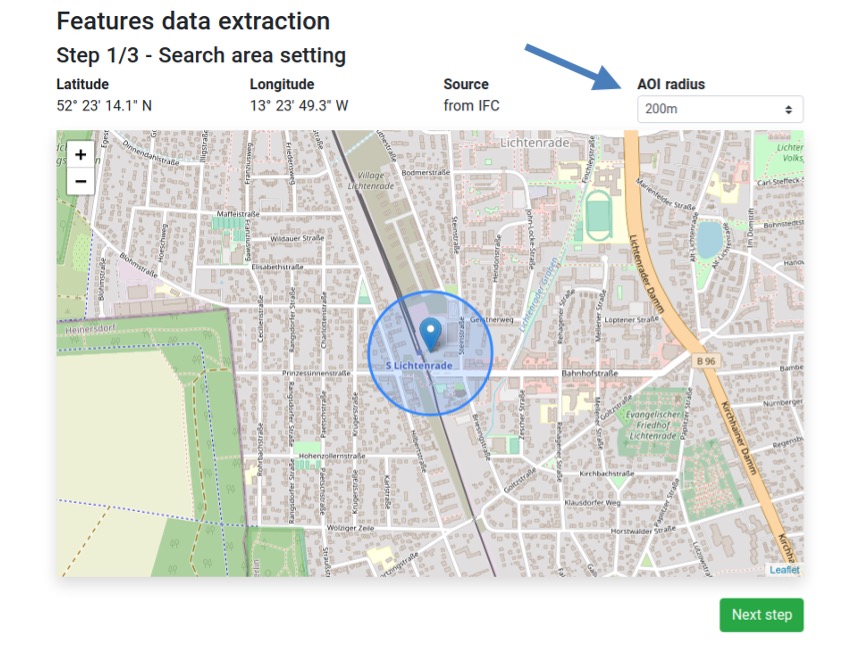
Fig17: Location and radius selection in GIS data provider service
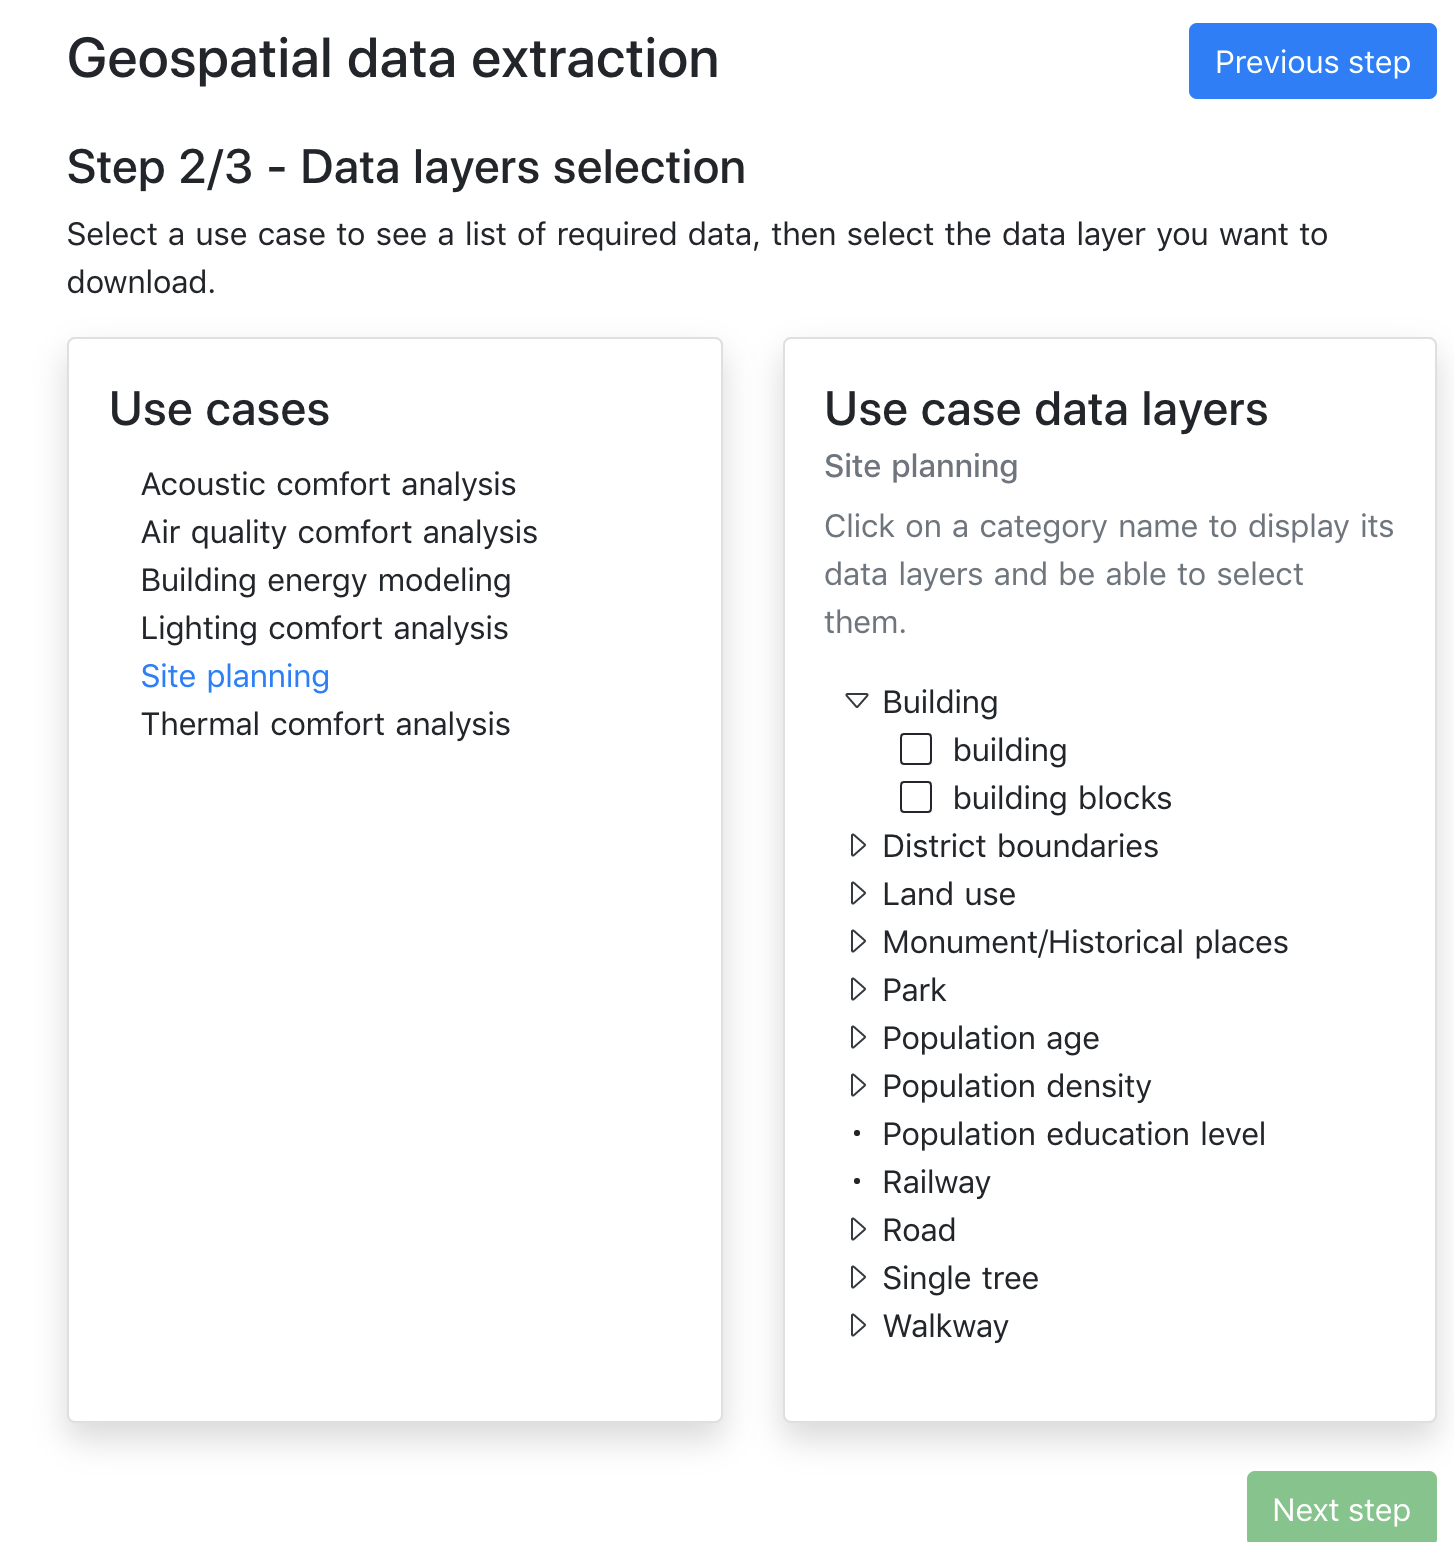
Fig18: Use case selection in GIS data provider service
As a pre-requisite to the use of the tool, the following are required:
In order to conceptualize the requirements of the renovation project based on the collected data, different maps are required to be created. These maps include information about:
In the process map, this step is demonstrated as shown in figure below. For generating the maps, it is important to have the data in a proper projection. Next step is determining what maps are required such as historical maps, green and blue areas and so on. For mapping surrounding buildings, it is important to check if 3D data are available for the area, otherwise the 2D polygons representing the footprints of the buildings can also be helpful.
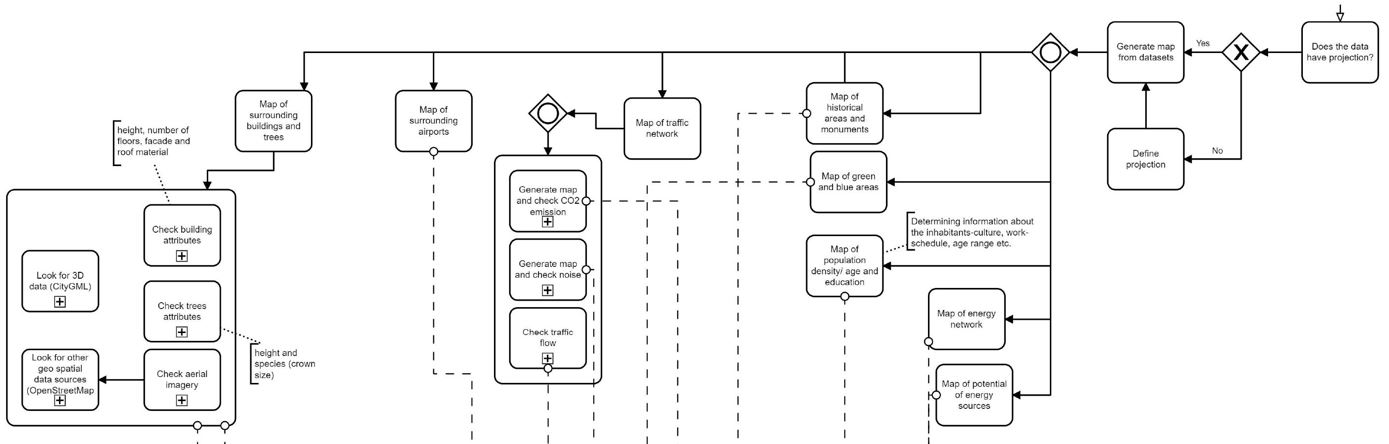
Fig19: Requirement conceptualization in process map
To create maps:
This step helps in decision-making based on available surrounding data and the information the provide, which is also reflected on the process map as shown in the figure below.
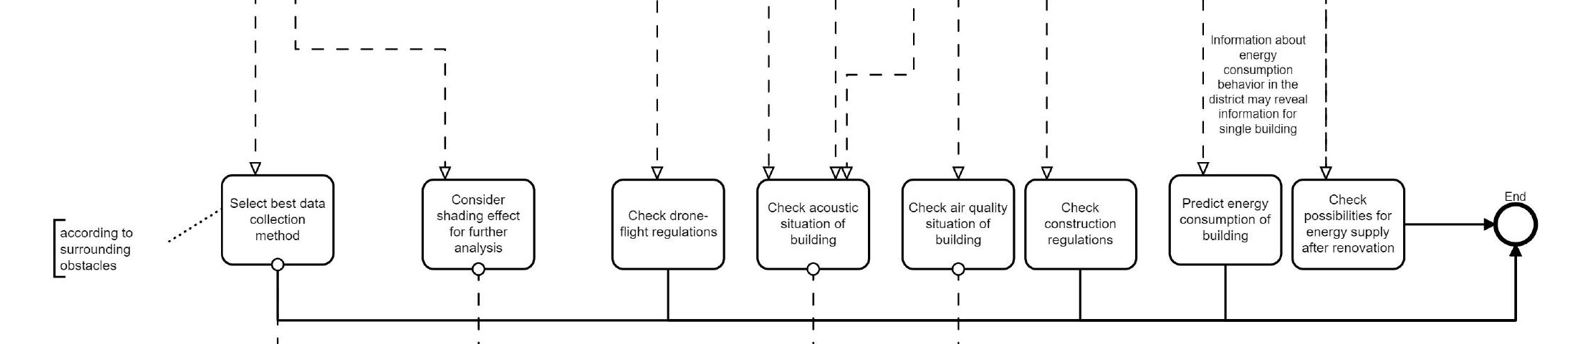
Fig20: Decision-making step in process map
The overall feasibility of using this tool has been observed based on the maps generated, a decision maker from the renovation team can decide about:
In comparison to the conventional approach for collecting the required datasets, these benefits can be seen in using the GIS data provider service:
For any location of interest, it is possible that all required data are not available, or some of the attributes are not retrievable. Decision-making based on geospatial data can be performed if these datasets are available for a specific location. Upon such availability, the information collected as mentioned in the demonstration site case, has aided in site planning and further analysis.