- Cas d'utilisation
- Co-Creation Space
Communauté
Organisations
Partenaires de collaboration

- Connexion
The 3D model can be viewed via blender, or our visualization tools. It provides better visibility and usability than the direct use of the 2D thermal scans. Higher visibility and visualization in general directly reduces the amount of errors that will need to be fixed post processing as well as simplifies the dialog between the different branches in the project, including the workers on site.
For the workers it’s both stimulating and with proven efficiency increase if they have the ability to see and understand the situation of the project regarding their part, as well as understanding the things that need to be fixed and why they need to be fixed.
(for further information about the benefits of visualization and worker’s involvement into the process there are great materials relating to Lean Management)
The texture of the model is made from the thermal scans, giving it appearance identical to the results of thermal simulations. This gives us the ability to compare the thermal situation of the simulation with the results in the real world.
The aim is improving visualization and hence also the quality of the process and the results of building and reconstructions.
The thermal scans and different measurements by themselves are something that requires higher level of competence as well significant amount of time even for the specialist to process it.
The 3D thermal model bundles up the necessary data in a 3D model that can be moved and rotated around and analyzed as an object held at hand. (via our tools)
This makes the process more comfortable which in turn reduces the amount of time needed for both analysis and presentation. Also the higher visibility reduces the amount of risk for errors.
Scope of the project is the application of the 3D thermal models for the process of visualization.

Ease and improvement of the pipeline process of building repair and reconstruction.
The quality of the model is limited by the hardware and the time restraints.
CAD – Computer Aided Design, refers to the 3D models created via technical CAD programs such as REVIT. Unlike the organic 3D models made via programs like Blender, CAD models and programs are characterized with complete control over every measurable dimension in the model to ensure buildability and repeatability of the of the physical model
We have 2 types of processes to bring out the 3D thermal model. The processes consist of the following actions:
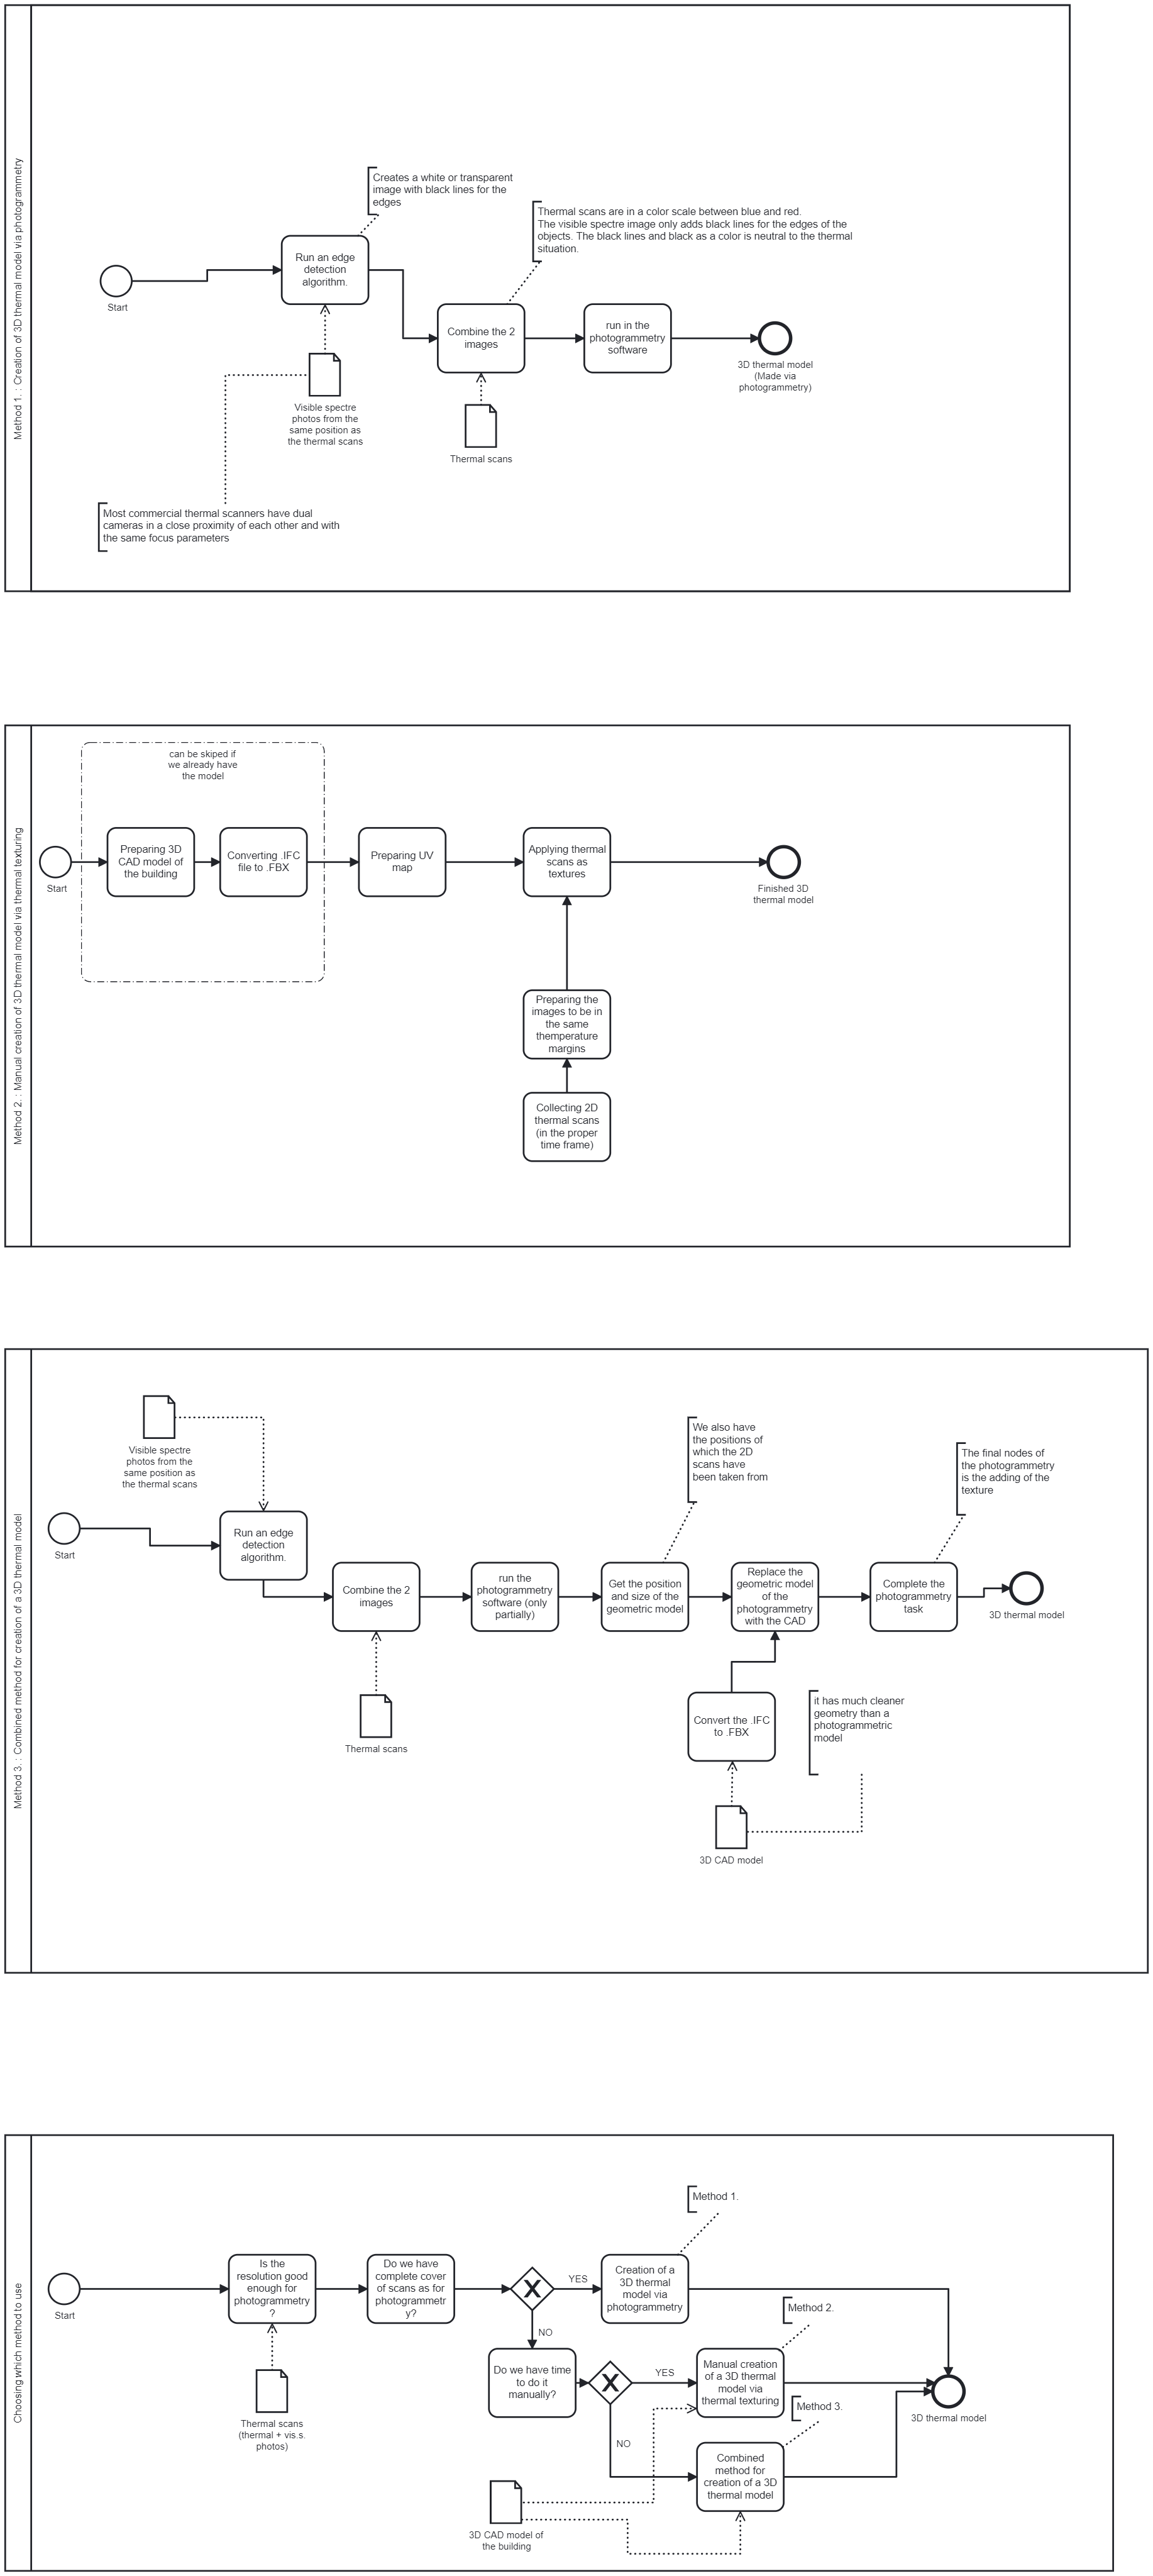
Figure: Process map for thermal model creation process
For Thermal texturing of CAD:
Collecting the thermal scans on site or via other means. Old scans for as long as they cover the entire building are good enough. The thermal scans are aligned in the same temperature margins. Consistency is of high importance. Also the images shouldn’t be taken in more than an hour between first and last.
For aesthetically better image it’s good to have both green and red areas in the building. For low temperature contrast the difference is around 15 degrees but for higher it goes up to 25 degrees or even more. The higher contrast situations are better for analysis of thermal bridges and other insolation defects on the building.
The sky is usually seen as endlessly cold and the sun and its reflection or other direct sources of infra-red can be seen as very high temperature. They should be ignored when deciding on the margins. Only the windows may reflect infra-red sunlight so they don’t affect the 3D thermal model as much. Also it’s preferable to make the scans at a cloudy day just to avoid this very situation.
Once the thermal margins are set the same on all the scans of the building that we are going to use, we can proceed to add them as texture onto the model.
The geometric 3D model is originally from a CAD file, usually from a REVIT file. It is converted to a “ organic” type of model such as .FBX so it can be used in a 3D modeling program like Blender. In there the UV map can be set up and the textures to be applied.
Complete tutorial with details of the process is provided.
For Thermal Photogrammetry:
The photos will need to be a lot more and have complete cover of the entire building and every single feature of the building so that there are not blind spots. Every feature will also need several photos so it can determine the geometry of it.
Once the thermal scans are collected, like in the previous method they need to be put in the same thermal margins. This can be set before the scan itself.
Each thermal scan provides one thermal image and one visible specter one. This may differ from other thermal scanning solutions, but it is a requirement in this method. The thermal image is then combined with the Edge Detection filtered visible specter image.
The edge detection filter is showing the edges as black lines which are neutral to the green to red gradient of the thermal spectrum.
Thermal cameras normally have a very low resolution when compared to visible specter ones, as well as low contrast between the geometric features of the objects. That’s why we need the visible specter images.
There are 2 ways to use them. One is to build the geometry by the visible specter ones and then switch them with the thermal ones for the step of texturing of the model. The other is the much simpler of combining the 2 images.
The edge detection filter may sound complicated but it is a built in feature and the default view in viewing the thermal scans for our mainstream thermal scanning solution.
The model has higher accuracy of the thermal texturing side, but it is slower to produce and scan and while more accurate it may look aesthetically less good than the Thermal Texturing of CAD model. The CAD model has better geometric accuracy than the photogrammetric model. Otherwise photogrammetry would be the industry standard in creating CAD models of buildings.
Demonstration site:
Varna (Dragoman)– 3D thermal models from both methods have been created for the current Façade. A 3D thermal model via Thermal Texturing of CAD of the Façade before renovation is created as well.
Malko Tarnovo – 3D thermal model via Thermal Texturing of CAD is created. 3D thermal model via Thermal Photogrammetry is in the process of being made. The thermal scans for it have been collected all that is pending is the actual photogrammetry process.
Vitoria – 2 buildings (referred to as Aldaba and Arcaya) have 3D thermal models via Thermal Texturing of CAD
The thermal models of Malko Tarnovo and Varna have already been used in the tests of our AR and VR Visualization projects.
The 3D thermal model is used in many of our tools for presentation and visualization. There is no better way to show the improvement of insolation than to provide the 3D thermal models from before and after the renovation.
Formats = .FBX, .OBJ ( standard 3D model type)
All dokuments are licensed as a Creative Commons Attribution-NonCommercial-ShareAlike 4.0 International License
(Attribution-Non-Commercial-ShareAlike 4.0). Further information can be found at
![]()
The documents reflect the current best practice and do not claim to be complete. They should not to be understood in the sense of a generally valid recommendation or guideline from a legal point of view. The documents are intended to support appointing and appointed parties in the application of the BIM method. The documents must be adapted to the specific project requirements in each case. The examples listed do not claim to be complete. Its information is based on findings from practical experience and is accordingly to be understood as best practice and not universally applicable. Since we are in a phase in which definitions are only emerging, the publisher cannot guarantee the correctness of individual contents.
PAS ENCORE INSCRIT?
Inscrivez-vous au Service de Gestion des Cas d'Utilisation gratuitement pour commencer à créer votre premier cas d'utilisation.
Les utilisateurs inscrits peuvent utiliser la zone de téléchargement et les fonctions de commentaire.

The 3D thermal model is used as part of the analysis prior, during and after reconstruction.
Thermal scanning equipment (such as FLIR E8), PC with support for CUDA (recent Nvidia graphic cards)